
Highlights
- Stock jumped over 10% to feature among NSE's top gainers.
- Price moved above the 63-day moving average with strong trading activity.
- Latest quarterly earnings kept the footwear stock in market focus.
Overview
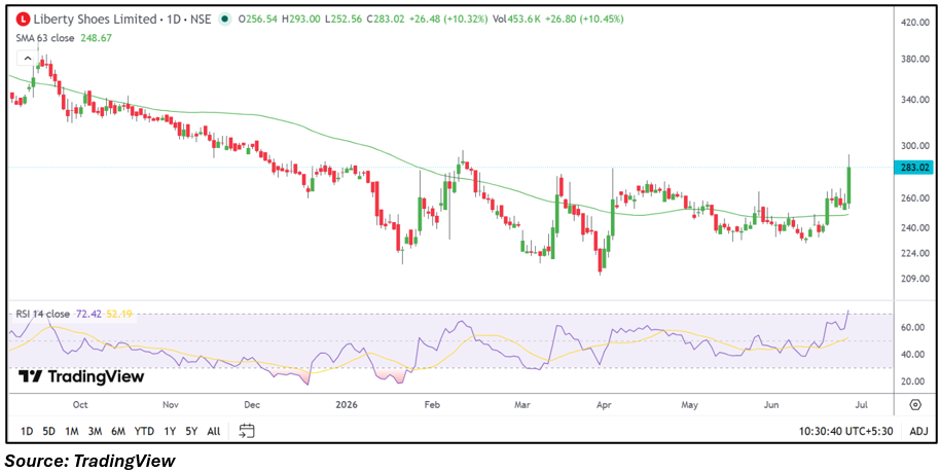
Liberty Shoes Limited (NSE: LIBERTSHOE) surged more than 10% during Thursday's trading session, making its way into the NSE's top gainers list. The stock climbed to an intraday high of ₹293.00 before trading around ₹283.35, compared with its previous close of ₹256.54. The sharp price move was accompanied by a noticeable increase in trading volumes, bringing the footwear manufacturer back into focus after a period of relatively range-bound trading.
Fundamental View
Liberty Shoes reported standalone total income of ₹21,227.81 lakh for the quarter ended March 2026. Profit before tax stood at ₹627.47 lakh, while net profit came in at ₹529.75 lakh. Earnings per share for the quarter was reported at ₹3.13. The latest financial performance reflects continued profitability, although no fresh corporate announcement or material development accompanied the sharp rise in the share price during the session.
Technical View
The stock registered a decisive breakout after consolidating near the ₹240.00–₹260.00 zone over recent weeks. During the session, Liberty Shoes moved above its 63-day simple moving average of ₹248.67, indicating an improvement in the near-term price structure. The 14-day RSI advanced to around 72.42 from its average near 52.19, reflecting stronger momentum following the latest rally. Higher trading volumes alongside the breakout indicate renewed market participation after a prolonged consolidation phase.
Key Technical Levels
Following the latest rally, the 63-day moving average near ₹248.67 becomes an important level to monitor on the downside. On the upside, the stock has tested an intraday high of ₹293.00, which now represents the immediate area being watched by market participants. Sustained trading activity around these levels could influence the stock's next directional move.
Risk to Watch
- Profit booking
- Volume sustainability
- Valuation pressure
- Broader market volatility
Summary
Liberty Shoes emerged among the NSE's top gainers after advancing more than 10% in Thursday's session. The move was supported by a breakout above its medium-term trend average, higher trading volumes and improving momentum indicators. While the company remains profitable based on its latest quarterly results, investors are likely to monitor whether the stock sustains the recent momentum and trading activity in the coming sessions.
FAQs
- Why did Liberty Shoes shares rise today?
The stock gained over 10% following a sharp rise in trading volumes and a breakout above its recent consolidation range. - How did Liberty Shoes perform in the latest quarter?
For the March 2026 quarter, standalone total income stood at ₹21,227.81 lakh, while net profit was ₹529.75 lakh. - What technical factors are investors tracking?
Market participants are watching whether the stock sustains above the 63-day moving average and maintains momentum near recent highs.