
Highlights
- Magellanic Cloud shares jumped over 16% to enter the top gainers list.
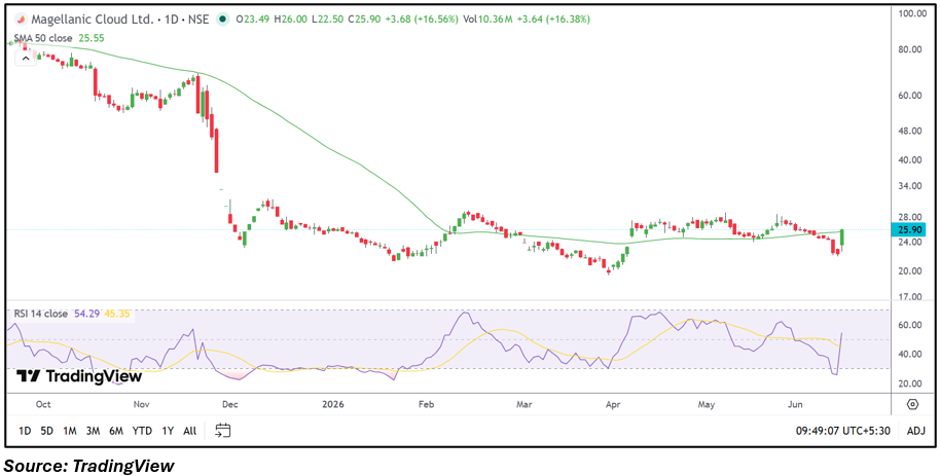
- The stock moved above its 50-day SMA after a sharp intraday rally.
- March quarter profit stood at INR 616.50 lakh on income of INR 2,601.19 lakh.
Overview
Magellanic Cloud (NSE: MCLOUD) attracted significant market attention on June 15 after the stock surged more than 16% during early trade. The sharp move pushed the counter into the list of top gainers on the NSE, with trading volumes also remaining elevated compared to recent sessions.
The stock opened at INR 23.49 and climbed to an intraday high of INR 26.00 before trading around INR 25.85, reflecting strong momentum during the session.
Fundamental View
For the quarter ended March 2026, Magellanic Cloud reported standalone total income of INR 2,601.19 lakh. Profit before tax came in at INR 825.17 lakh, while net profit stood at INR 616.50 lakh.
The company remained profitable during the quarter, and investors may be tracking its earnings performance alongside the recent rise in share price. However, the earnings per share reported for the quarter remained at zero.
Technical View
Magellanic Cloud is currently trading around INR 25.85, up 16.34% in the session. The stock has moved above its 50-day SMA of INR 25.55 after spending several weeks consolidating around the moving average. Price action indicates a rebound from recent lows, with buyers regaining control in the short term. RSI has improved to around 54.29, suggesting momentum has strengthened from previously weaker levels.
Momentum Indicator
The RSI (14) reading is around 54.29, recovering above the neutral zone. This suggests improving momentum and indicates that the stock is no longer in the weak zone seen earlier this month.
Key Technical Levels
From the current price of INR 25.85, immediate support is placed around INR 24.55, while the next support zone is seen near INR 23.25. On the upside, resistance may emerge around INR 27.15, followed by a higher resistance zone near INR 28.45. A sustained move above resistance levels could keep momentum active, while weakness below support areas may increase volatility.
Risks to Watch
- High historical price volatility.
- Sharp volume-driven price swings.
- Limited visibility on earnings consistency.
- Profit-booking after a strong rally.
Summary
Magellanic Cloud shares surged more than 16% on June 15, making it one of the top-performing stocks on the NSE. The stock moved above its 50-day SMA and showed improving momentum indicators. While the company reported a profit in the March 2026 quarter, investors may continue monitoring whether the recent rally can sustain amid the stock's historically volatile trading pattern.
FAQs
- Why is Magellanic Cloud stock rising today?
The stock gained over 16% amid strong buying activity and improved short-term price momentum. - What were Magellanic Cloud's March 2026 quarterly results?
The company reported net profit of INR 616.50 lakh on total income of INR 2,601.19 lakh. - Is MCLOUD trading above its 50-day SMA?
Yes, the stock is currently trading above its 50-day SMA of approximately INR 25.55.