
Highlights
- Mahalaxmi Rubtech shares declined over 5% amid broad selling pressure.
- The stock slipped below its 50-day SMA, weakening the near-term setup.
- Despite the correction, the company reported a profitable March 2026 quarter.
Overview
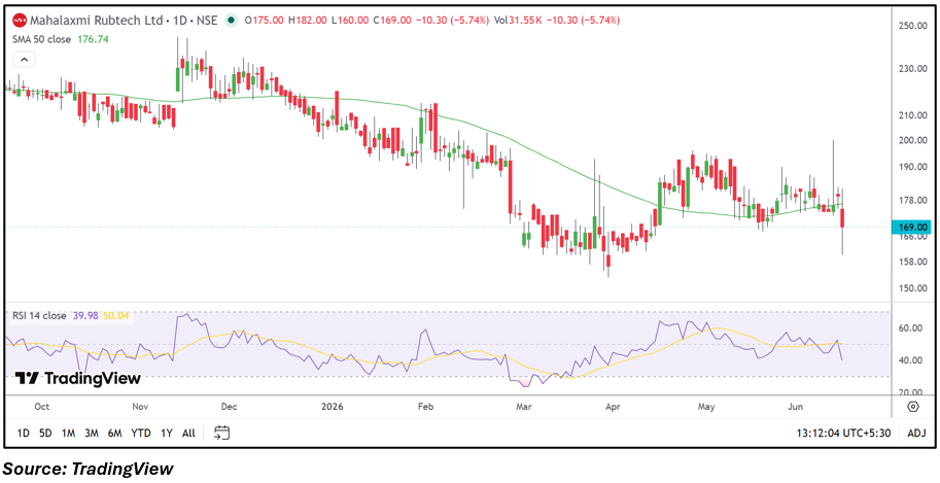
Mahalaxmi Rubtech (NSE: MHLXMIRU) remained under pressure on June 15, 2026, with the stock falling 5.74% to ₹169.00. The decline came despite a profitable quarterly performance and reflects a deterioration in short-term market sentiment toward the stock.
The counter traded between ₹160.00 and ₹182.00 during the session, highlighting elevated volatility as sellers dominated trading activity. The latest move has placed the stock among the notable laggards on the NSE.
Fundamental View
For the quarter ended March 2026, Mahalaxmi Rubtech reported standalone total income of ₹3,083.50 lakh. Profit before tax stood at ₹733.43 lakh, while net profit came in at ₹542.62 lakh. The company reported earnings per share (EPS) of ₹5.11.
The latest results indicate that the company remained profitable during the quarter. However, market participants often weigh future growth expectations and price momentum alongside reported earnings, which may explain the recent weakness in the share price.
Technical View
Mahalaxmi Rubtech is currently trading at ₹169.00, down 5.74% during the session. The stock has slipped below its 50-day SMA of ₹176.74, indicating that the near-term technical structure has weakened.
Price action shows that the stock failed to sustain recent recovery attempts and encountered selling pressure near higher levels. The sharp decline from the day's high of ₹182.00 suggests that sellers regained control during the session, resulting in a breakdown below an important moving-average reference.
Momentum Indicator
The RSI has eased to around 40, moving below its signal line and reflecting weakening momentum. The indicator suggests that bearish sentiment has increased compared with previous sessions.
Key Technical Levels
From the current price of ₹169.00, immediate support is seen around ₹160.00, which also marked the day's low. A stronger support zone is positioned near ₹155.00. On the upside, resistance may emerge around ₹177.00, close to the 50-day SMA, while a sustained move above this level could bring the ₹182.00 zone back into focus. Traders may closely monitor whether the stock can reclaim its moving-average level in the coming sessions.
Risks to Watch
- Continued weakness below the 50-day SMA.
- Lower trading activity may increase volatility.
- Profit-taking pressure could persist.
- Weak momentum may delay recovery attempts.
Summary
Mahalaxmi Rubtech shares underperformed the broader market after falling more than 5% and slipping below their 50-day SMA. While the company reported profitable quarterly results, the current technical structure reflects increasing selling pressure. Investors will be watching whether the stock can stabilize near support levels and regain momentum in the sessions ahead.
FAQs
Why did Mahalaxmi Rubtech shares fall today?
The stock witnessed selling pressure and slipped below its 50-day SMA, weakening the short-term technical outlook.
Did the company report a profit in the latest quarter?
Yes. Mahalaxmi Rubtech reported a net profit of ₹542.62 lakh for the March 2026 quarter.
What is the key technical level to watch?
The area around the 50-day SMA near ₹176.74 remains an important level for traders monitoring a potential recovery.