
Highlights
- Mahalaxmi Rubtech shares plunged nearly 10% amid intensified selling pressure.
- The stock broke below key trading zones, triggering a sharp rise in volatility.
- Technical indicators suggest weakening momentum despite profitable quarterly performance.
Overview
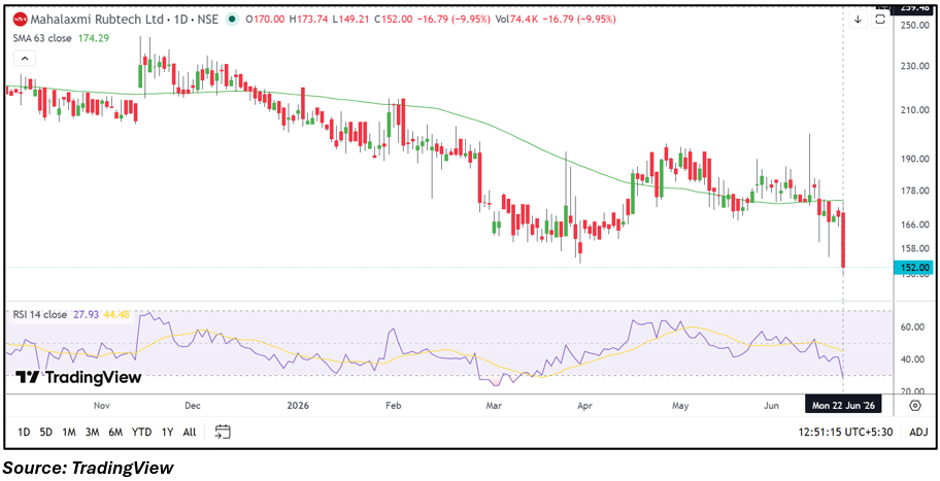
Mahalaxmi Rubtech Limited (NSE: MHLXMIRU) witnessed significant selling pressure on June 22, with the stock falling 9.95% to ₹152.00. The decline came after the stock failed to sustain recent consolidation levels and slipped sharply during the session. Increased volatility, low liquidity conditions, and the presence of fewer active market participants appear to have amplified price swings, resulting in a steep correction.
Fundamental View
For the quarter ended March 2026, the company reported standalone total income of ₹3,083.50 lakh. Profit before tax stood at ₹733.43 lakh, while net profit came in at ₹542.62 lakh. Earnings per share were reported at ₹5.11. Despite the profitable quarterly performance, the current weakness appears to be driven primarily by market sentiment and technical factors rather than a deterioration in reported earnings.
Technical View
The stock has remained under pressure over the past several months and is currently trading below its 63-day moving average of ₹174.29. The latest session witnessed a decisive breakdown below recent consolidation levels, reflecting increased bearish momentum. The RSI has dropped to around 27.93, indicating oversold conditions after the sharp decline. While oversold readings may sometimes lead to short-term stabilization, the current price structure remains weak until the stock reclaims higher trading zones.
Key Technical Levels
The immediate support zone is placed near ₹149.00, followed by a stronger support area around ₹140.00. On the upside, resistance is likely to emerge near ₹168.00, while a sustained move above ₹175.00 could improve near-term sentiment and reduce downside pressure.
Risks To Watch
- Breakdown below ₹149.00 may accelerate selling pressure.
- Low liquidity can increase price volatility.
- Weak momentum may limit recovery attempts.
- Failure to reclaim resistance zones could prolong weakness.
Summary
Mahalaxmi Rubtech shares came under heavy selling pressure as the stock broke below recent consolidation levels and slipped nearly 10% in a single session. Although the company reported profitability in its latest quarterly results, technical indicators currently point to weakening momentum and elevated volatility. Traders may closely monitor support near ₹149.00 and resistance around ₹168.00 to gauge the stock’s next directional move.
FAQ
Why did Mahalaxmi Rubtech shares fall sharply today?
The decline was driven by heavy selling pressure, increased volatility, and a breakdown below recent trading levels.
Are the company’s fundamentals deteriorating?
The latest quarterly results remained profitable, indicating the decline is largely technical in nature.
What levels should traders monitor?
Support is near ₹149.00 and ₹140.00, while resistance is located around ₹168.00 and ₹175.00.