
Highlights
- MBL Infrastructure shares corrected after a sharp rally toward recent highs.
- The stock continues to trade above its 50-day SMA despite the decline.
- RSI remains above neutral levels, indicating momentum has not fully faded.
Overview
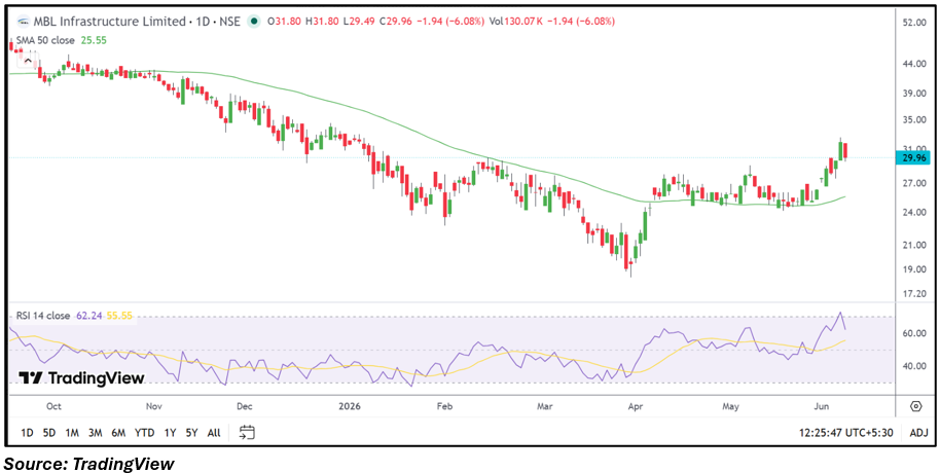
MBL Infrastructure (NSE: MBLINFRA) came under pressure on June 8, with the stock trading at ₹29.96, down ₹1.94 from the previous close. The decline follows a strong upward move that lifted the stock above the ₹31.00 zone in recent sessions. While the latest session reflects profit-taking activity, the broader trend remains stronger than earlier in the year as the stock continues to trade above its 50-day Simple Moving Average (SMA) of ₹25.55.
Fundamental View
MBL Infrastructure reported standalone total income of ₹9,218.00 lakh for the quarter ended March 2026. The company posted a profit before tax of ₹5,315.00 lakh and net profit of ₹81.00 lakh, with earnings per share (EPS) at ₹0.07. The latest financial performance indicates profitability, though earnings remain relatively modest compared with revenue levels.
Technical View
MBL Infrastructure is trading at ₹29.96 while remaining above its 50-day SMA of ₹25.55, reflecting that the broader near-term structure remains constructive despite the latest correction. Price action recently accelerated toward the ₹31.00 region before witnessing profit booking. The 14-day RSI stands at 62.24, remaining above the neutral 50 mark and suggesting momentum is still positive, although the stock has cooled from recent highs.
Momentum Indicator
The RSI reading of 62.24 indicates momentum remains favorable despite the decline. However, the stock has moved away from recent peak momentum readings, suggesting traders are reassessing positions after the sharp advance.
Key Technical Levels
On the downside, immediate support is placed near ₹28.50, followed by a stronger support zone around ₹27.00. These levels could become important if selling pressure continues.
On the upside, resistance is seen near ₹31.50, while a move above that region may bring the ₹33.00 zone into focus. Sustained trading above resistance levels would be needed to revive upward momentum.
Key Risks to Watch
- Volatility following the recent sharp rally.
- Low EPS relative to market valuation.
- Profit-booking pressure near resistance zones.
- Infrastructure sector execution risks.
Summary
MBL Infrastructure shares have corrected after a rapid advance, but the stock continues to trade above its 50-day SMA of ₹25.55. The RSI at 62.24 indicates momentum remains positive even after the decline. While near-term volatility may persist, the broader structure remains constructive as long as the stock holds above key support zones and avoids a deeper breakdown below recent swing levels.
FAQs
- Why did MBL Infrastructure shares fall today?
The stock witnessed profit-taking after a strong rally, leading to a pullback from recent highs. - Is MBL Infrastructure still above its key moving average?
Yes, the stock remains above its 50-day SMA of ₹25.55 despite the recent decline. - What does the RSI indicate for MBL Infrastructure?
The RSI of 62.24 suggests momentum remains positive, though it has moderated from recent peaks.