
Highlights
- The stock surged over 16% with strong intraday momentum.
- Short-term returns significantly outpaced NIFTY 50 benchmark.
- Technical indicators signal breakout with rising momentum levels.
Shares of NK Industries Limited (NSE:NKIND) were trading at ₹73.89 as of April 15, 2026, registering a gain of 18.21%. The stock opened at ₹63.50 and climbed to an intraday high of ₹75.01, while the low remained at ₹63.50, indicating strong upward movement.
The previous close stood at ₹62.51, and the VWAP was ₹74.55. The order book reflects buying dominance, with over 91% of total quantity on the buy side, indicating strong demand during the session.
Returns Compared to Benchmark
NK Industries Limited has delivered higher returns than the NIFTY 50 across short-term periods. Over the past week, the stock gained 14.92% compared to 0.85% for the index.
Monthly returns stand at 19.87%, significantly above the index return of 4.53%. On a year-to-date basis, the stock gained 12.21%, while the benchmark declined 7.44%.
However, one-year performance shows a decline of 9.77%, compared to a gain of 3.74% in the index. Over longer periods, returns remain higher, with 3-year returns at 78.38% versus 35.75%, and 5-year returns at 227.43% compared to 65.97% for the index.
Financial Performance Snapshot
For the quarter ended December 31, 2025, consolidated total income stood at ₹271.27 lakh. The company reported a loss, with profit before tax at ₹-72.82 lakh and net loss at ₹-80.85 lakh. Earnings per share (EPS) was ₹-1.35.
On a standalone basis, total income stood at ₹73.38 lakh, with a net loss of ₹-69.55 lakh and EPS at ₹-1.16.
These figures are based on unaudited financial results released in February 2026.
Technical Indicators and Momentum
The stock has broken above its 21-day simple moving average near ₹63.36, indicating a technical breakout. It has formed a base around the ₹57.00–₹60.00 range and rebounded sharply from these levels.
The 14-day RSI stands near 66.85, reflecting rising momentum and approaching overbought levels. Immediate support is seen in the ₹67.00-62.00 zone, while resistance is observed near ₹80.00-87.00 levels.
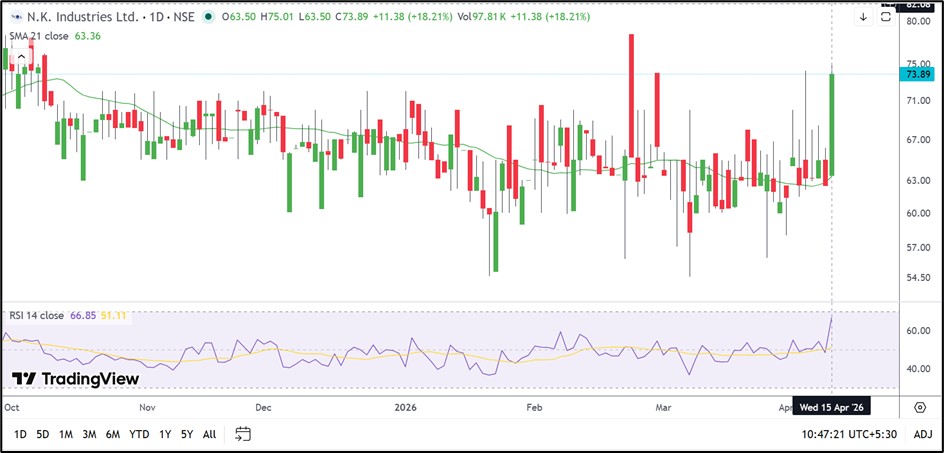
Source: TradingView
Trading and Volatility Indicators
The company has a total market capitalisation of ₹43.69 crore and a free float market cap of ₹11.68 crore. Traded volume during the session was 1.34 lakh shares, translating into a traded value of ₹1.00 crore.
Impact cost stands at 5.97, indicating low liquidity. Daily volatility is recorded at 3.83%, while annualised volatility stands at 73.17%, reflecting sharp price fluctuations.
The deliverable quantity stands at 58.73% of traded volume, indicating moderate delivery-based participation.
Key Risks
- Low liquidity indicated by high impact cost may affect trading.
- Negative earnings reflect ongoing profitability challenges.
- High volatility may lead to sharp price swings.
- Limited investor participation indicated by low PAN activity.
Summary
NK Industries Limited shares recorded a sharp rise during the session, supported by strong buying activity and a technical breakout above key levels. The stock has outperformed the NIFTY 50 in short-term periods, though one-year returns remain negative. Financial data indicates losses in recent quarters. Liquidity constraints and volatility remain important considerations.
FAQs
- Why did NK Industries stock rise sharply today?
The stock gained over 16% due to strong buying interest and a breakout above key technical levels. - What do technical indicators suggest for NK Industries stock?
Indicators show strong momentum with RSI rising, suggesting continued interest but possible near-term consolidation. - What are the key concerns for NK Industries?
Key concerns include low liquidity, negative earnings, high volatility, and limited investor participation.