
Highlights
- Pace Digitek shares surged more than 11% amid a sharp increase in trading volumes.
- The stock crossed the ₹200 mark after breaking above a recent consolidation range.
- Strong quarterly earnings and improving profitability supported positive market sentiment.
Overview
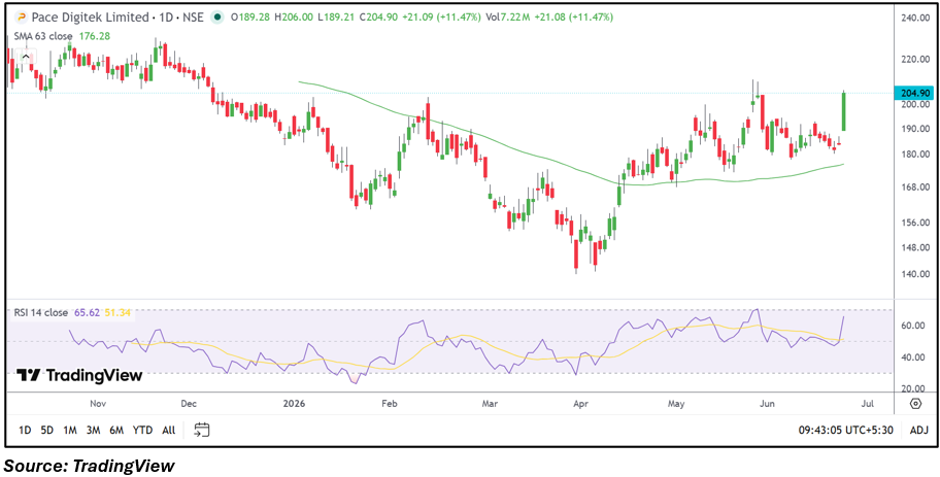
Pace Digitek Limited (NSE: PACEDIGITK) emerged among the top gainers on June 23, 2026, with the stock rising over 11% to ₹204.80. The rally pushed the stock to a fresh multi-month high and came alongside robust trading activity, indicating heightened market participation.
The stock opened at ₹189.28 and advanced to an intraday high of ₹206.00, comfortably surpassing the psychologically important ₹200 level. The move follows several weeks of consolidation and signals renewed momentum in the counter.
Fundamental View
For the quarter ended March 2026, Pace Digitek reported standalone total income of ₹50,383.70 lakh. Profit before tax stood at ₹6,936.70 lakh, while net profit came in at ₹4,061.80 lakh. Earnings per share were reported at ₹2.06.
The company's profitability and earnings performance may have contributed to the positive sentiment seen in the stock. Market participants appear to be responding to the combination of stable financial performance and improving price action.
Technical View
Technically, PACEDIGITK has delivered a decisive breakout above its recent trading range. After spending several weeks fluctuating near the ₹175–₹195 zone, the stock witnessed strong buying momentum and moved above previous swing highs.
The stock is trading above its medium-term trend levels, while momentum indicators have strengthened considerably. The breakout accompanied by higher volumes suggests increased market interest, though short-term volatility may remain elevated following the sharp advance.
Key Technical Levels
The stock is currently trading near ₹204.80 after touching an intraday high of ₹206.00. Immediate support is placed around ₹195.00, followed by a stronger support zone near ₹184.00. On the upside, resistance may emerge around ₹210.00, while a sustained move above this level could pave the way toward the ₹225.00 region.
Risks to Watch
- Sharp rallies may invite near-term profit booking.
- Volatility could increase following the breakout move.
- Earnings growth may fluctuate with business conditions.
- Failure to hold above breakout levels may weaken momentum.
Summary
Pace Digitek shares rallied more than 11% as the stock broke above key consolidation levels and crossed the ₹200 mark. Strong quarterly profitability, rising trading volumes, and improving technical momentum contributed to the advance. The breakout has strengthened the stock's near-term structure, although traders may watch closely for consolidation after the sharp one-day move. Sustaining levels above the recent breakout zone could remain important for maintaining momentum.
FAQ
- Why did Pace Digitek shares rise more than 11% today?
The stock surged after breaking above a prolonged consolidation range with strong volumes and improving market sentiment.
- How did Pace Digitek perform in the latest quarter?
The company reported ₹50,383.70 lakh in total income and ₹4,061.80 lakh in net profit for March 2026.
- What are the key levels to watch in PACEDIGITK stock?
Support is seen near ₹195.00 and ₹184.00, while resistance is placed around ₹210.00 and ₹225.00.