
Highlights
- Paramount Communications shares climbed more than 11% during Friday’s session.
- The stock crossed above recent consolidation levels with heavy trading activity.
- RSI entered elevated territory as bullish momentum accelerated sharply.
Overview
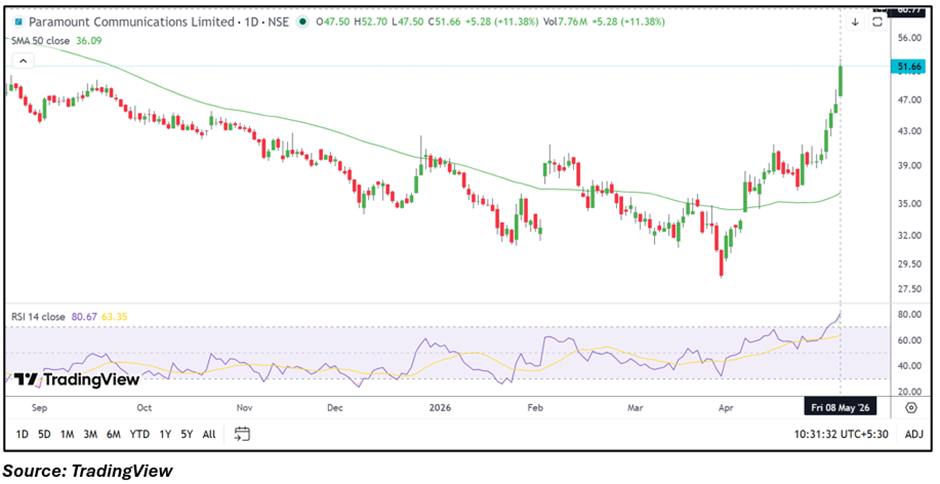
Paramount Communications (NSE: PARACABLES) gained strong market attention after the stock rallied 11.36% on May 8, 2026, trading near ₹51.65 during the session. The stock opened at ₹47.50 and touched an intraday high of ₹52.70 compared to the previous close of ₹46.38.
The sharp move extended the stock’s ongoing recovery trend and positioned it among the top gaining mid-cap counters during the trading session.
Fundamental View
For the quarter ended December 31, 2025, Paramount Communications reported consolidated total income of INR 46,574.00 lakh. Profit before tax stood at INR 1,037.00 lakh, while consolidated net profit came at INR 748.00 lakh. Earnings per share for the quarter was reported at INR 0.25.
Investors continue tracking cable demand trends, telecom infrastructure spending, industrial capex activity, and execution visibility across power and connectivity-related projects.
Technical View
Paramount Communications is trading near ₹51.65, up 11.36%, and remains firmly above its 50-day SMA around ₹36.09, indicating a sharply improved near-term structure. Price action reflects a strong breakout after the stock consolidated in the ₹40–₹46 range over recent weeks.
The latest rally also pushed the stock closer to fresh multi-month highs amid expanding volume activity and aggressive directional movement.
Momentum Indicator
The 14-day RSI climbed near 80.67, suggesting momentum has strengthened significantly and entered elevated territory following the latest breakout move. Higher RSI readings may also increase short-term volatility near resistance levels.
Key Technical Levels
- Immediate Support: ₹47.00
- Secondary Support: ₹44.00
- Immediate Resistance: ₹55.00
- Higher Resistance: ₹60.00
Risks To Watch
- Elevated RSI may trigger intermittent profit booking.
- Volatility can increase near resistance zones.
- Weak infrastructure demand may impact business visibility.
- Sustaining price action above ₹47 remains technically important.
Summary
Paramount Communications shares rallied sharply as strong momentum and increased market participation pushed the stock above key technical levels. The breakout improved the near-term structure significantly and lifted RSI into elevated territory. Traders may continue monitoring whether the stock sustains above ₹47 while approaching resistance near ₹55–₹60.
FAQs
Why did Paramount Communications shares rally today?
The stock gained after witnessing strong breakout momentum and increased trading activity during the session.
What are the key support levels for PARACABLES?
Immediate support is placed near ₹47, while the next major support zone is around ₹44.
Why is RSI important for Paramount Communications currently?
RSI near 81 reflects elevated momentum and suggests the stock may remain volatile near higher resistance zones.