
Highlights
- Primo Chemicals shares surged over 13% and emerged among the day's top gainers.
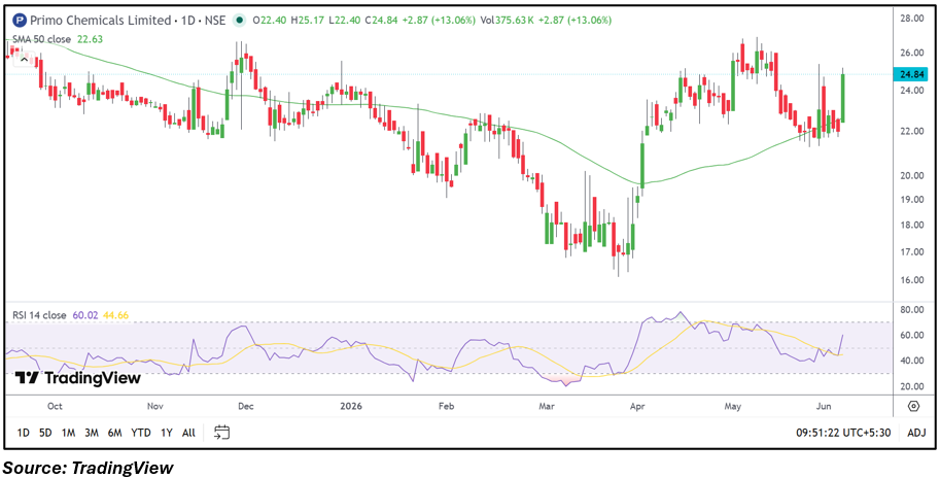
- The stock moved above its 50-day SMA and broke out of a recent consolidation range.
- RSI momentum strengthened, reflecting renewed buying activity on the daily chart.
Overview
Primo Chemicals (NSE: PRIMO) gained sharply on June 5, with the stock rising 13.43% to ₹24.92. The rally came as the stock broke above a multi-week consolidation zone and moved to its highest level in recent weeks. The move was accompanied by increased trading activity, placing the stock among the top gainers on the NSE.
The company's latest March 2026 quarter reported consolidated total income of ₹15,051.35 lakh, profit before tax of ₹782.45 lakh, and net profit of ₹607.45 lakh.
Fundamental View
Primo Chemicals remained profitable in the March 2026 quarter, reporting net profit of ₹607.45 lakh on total income of ₹15,051.35 lakh. While the stock carries a relatively elevated valuation, the latest quarterly performance indicates that the company continues to generate positive earnings and maintain profitability.
Investors may continue monitoring future earnings trends, margins, and demand conditions in the chemicals sector for further clues on business performance.
Technical View
Primo Chemicals is trading at ₹24.92, significantly above its 50-day SMA of ₹22.63, indicating an improving near-term technical structure. The stock spent several weeks consolidating between approximately ₹22 and ₹24 before delivering a decisive breakout on the daily chart.
The RSI has climbed to around 60, moving above its signal line and indicating strengthening momentum. The breakout from consolidation suggests buyers have regained control after a prolonged range-bound phase. Sustaining above the breakout zone could keep the near-term structure constructive.
Momentum Indicator
The 14-day RSI stands near 60, reflecting improving momentum without entering deeply overbought territory. The indicator has turned higher after spending several sessions in a neutral range, supporting the recent price breakout.
Key Technical Levels
On the daily chart, immediate support is placed near ₹23.50, which coincides with the recent breakout zone and may act as an important demand area. A stronger support level is visible around ₹22.60 near the 50-day SMA. On the upside, the stock faces immediate resistance near ₹25.20, which marks the recent intraday high. A sustained move above this level could open the door toward the next resistance zone around ₹26.50.
Risks to Watch
- Elevated valuation compared with historical earnings.
- Volatility following sharp short-term price gains.
- Raw material cost fluctuations.
- Sector-wide demand slowdown affecting profitability.
Summary
Primo Chemicals has attracted attention after a strong breakout from a prolonged consolidation range on the daily chart. The stock is trading above its 50-day SMA, while RSI momentum has strengthened, supporting the recent advance. Fundamentally, the company reported profitability in the March 2026 quarter. Traders may watch whether the stock can sustain above the breakout area and build on its recent gains.
FAQs
- Why is Primo Chemicals stock rising today?
The stock surged after breaking above a consolidation range and moving above its 50-day SMA on strong momentum.
- What is the current technical outlook for Primo Chemicals?
The near-term structure has improved, with the stock trading above key averages and RSI showing strengthening momentum.
- What are the key levels to watch in Primo Chemicals?
Support is seen near ₹23.67 and ₹22.43, while resistance levels are around ₹26.17 and ₹27.41.