
Highlights
- Rama Phosphates shares dropped nearly 8% despite the company reporting quarterly profit.
- Weak price structure below the 50-day SMA kept traders cautious during the session.
- RSI momentum slipped sharply, indicating fading short-term market strength in the stock.
Overview
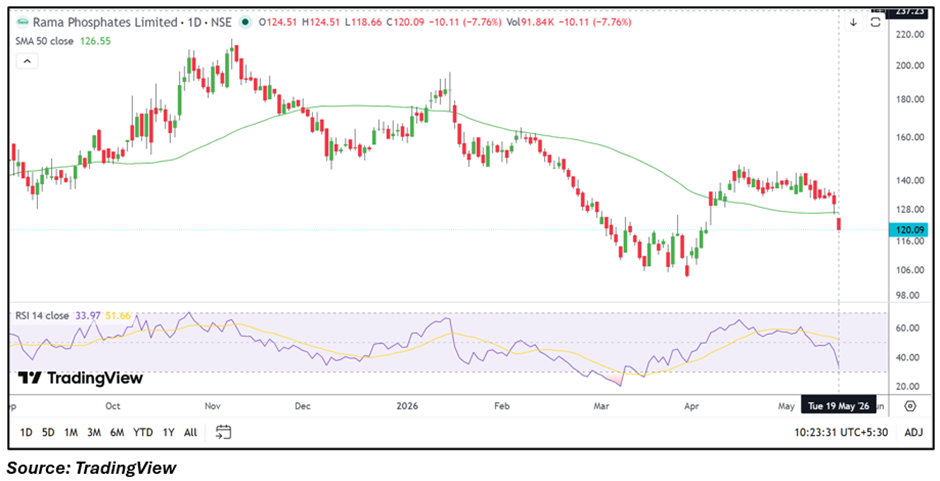
Rama Phosphates Limited shares came under selling pressure on May 19, with the stock declining nearly 8% to around ₹120.08 during intraday trade. The sharp decline came even after the company reported a profitable March 2026 quarter, reflecting cautious market sentiment and profit-booking activity after recent consolidation near higher levels.
The company reported standalone total income of ₹21,972.78 lakh for the quarter ended March 2026. Profit before tax stood at ₹684.50 lakh, while net profit came in at ₹536.67 lakh with EPS of ₹1.52.
Fundamental View
The latest quarterly numbers showed the company remained profitable during the reporting period, though investors appeared concerned about growth sustainability and margin visibility. Market participants may also be reacting to valuation comfort, sector-wide volatility, and near-term earnings expectations.
Fertilizer and chemical-linked counters have recently witnessed sharp price swings amid changing commodity trends and fluctuating raw material costs. The absence of a major earnings surprise may have also triggered short-term selling pressure in the counter.
Technical View
Rama Phosphates stock is currently trading near ₹120.08 and has slipped below its 50-day SMA placed around ₹126.55, indicating a weak near-term technical structure. Recent price action reflects renewed downside pressure after the stock failed to sustain momentum near higher levels. The 14-day RSI has dropped near 33.97, showing weakening momentum and approaching the oversold zone. The sharp decline also indicates increased volatility as traders react to the breakdown below short-term moving averages.
Momentum Indicator
The RSI reading near 33 suggests momentum has weakened significantly in the short term. A sustained recovery in RSI may be required for stabilization in price action.
Key Technical Levels
- Support: ₹110–₹99
- Resistance: ₹131–₹145
Risks to Watch
- Rama Phosphates faces commodity price volatility affecting input cost stability.
- Weak technical structure may keep near-term sentiment under pressure.
- Earnings growth consistency remains a key concern for investors.
- Broader market volatility may increase sharp price swings in the stock.
Summary
Rama Phosphates shares witnessed sharp selling pressure despite reporting quarterly profit, as weak technical indicators and cautious sentiment weighed on the stock. The counter has slipped below its 50-day SMA while RSI momentum has weakened sharply. Traders are now watching whether support near ₹110 can stabilize the current decline, while resistance near ₹131 may limit immediate upside recovery attempts.
FAQs
- Why did Rama Phosphates shares fall despite reporting profit?
The stock declined as traders reacted to weak technical structure and cautious near-term market sentiment. - What are the important support levels for Rama Phosphates stock?
Immediate support is placed near ₹110, followed by a broader support zone around ₹99. - What does the RSI indicate for Rama Phosphates shares?
The RSI near 33 indicates weakening momentum and suggests the stock is nearing oversold territory.