
Highlights
- RTNINDIA surged more than 15% and emerged among the top gainers on the NSE.
- The stock broke above a recent consolidation range and moved past its 50-day SMA.
- Momentum indicators strengthened significantly, with RSI entering overbought territory.
Overview
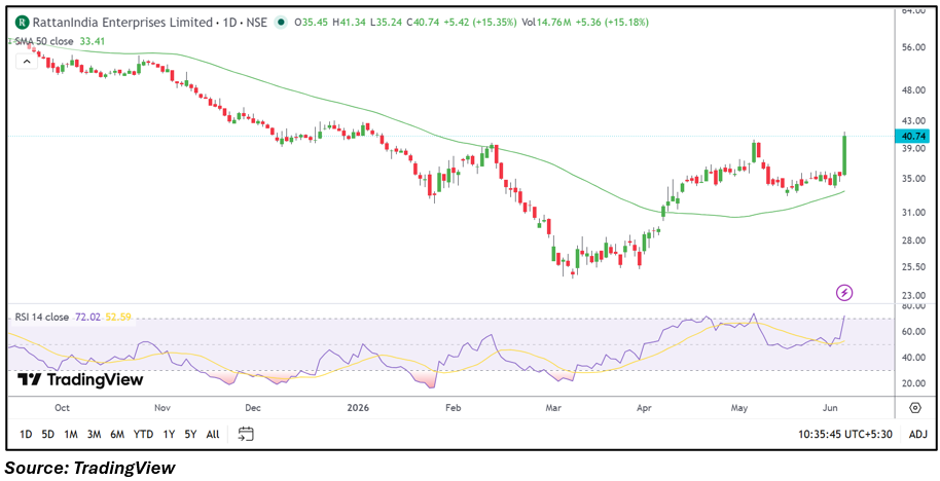
RattanIndia Enterprises (NSE: RTNINDIA) rallied sharply on June 4, with the stock gaining 15.15% to ₹40.67. The move placed the stock among the session's top gainers and marked a decisive breakout from its recent trading range. The surge comes despite the company reporting a quarterly loss, suggesting that technical factors and market sentiment are currently driving the stock's price action.
Fundamental View
For the quarter ended March 2026, RattanIndia Enterprises reported standalone total income of INR 429.00 lakh. The company posted a loss before tax of INR 14,411.30 lakh and a net loss of INR 12,475.70 lakh. Earnings per share stood at negative INR 0.90.
Despite the weak quarterly performance, the stock witnessed strong buying activity, indicating that traders may be focusing more on the improving chart structure and future business expectations rather than recent earnings.
Technical View
RTNINDIA is currently trading at ₹40.67, well above its 50-day SMA of ₹33.41, reflecting a significant improvement in the near-term technical structure. Recent price action shows the stock breaking out from a prolonged consolidation zone and recording a strong bullish candle.
The 14-day RSI has climbed to 72.02, indicating strong momentum conditions. While the indicator has entered overbought territory, it also highlights the strength behind the current rally.
Momentum Indicator
Momentum has accelerated sharply, with RSI moving above the 70 mark for the first time in several weeks. The indicator reflects sustained upside strength and confirms the breakout seen on the daily chart.
Key Technical Levels
The immediate support level is placed near ₹38.64. If the stock experiences a pullback, the next support zone is located around ₹36.60.
On the upside, the first resistance is seen near ₹42.70. A sustained move above this level could bring the next resistance area around ₹44.74 into focus.
Risks to Watch
- Quarterly losses may continue to weigh on sentiment.
- Overbought RSI conditions could trigger profit booking.
- Failure to hold above the breakout zone.
- Elevated volatility following the sharp rally.
Summary
RattanIndia Enterprises surged more than 15% after breaking above its recent consolidation range and reclaiming levels above its 50-day SMA. Although the company reported a quarterly loss, technical indicators have strengthened considerably, with RSI moving into overbought territory. Support levels are placed near ₹38.64 and ₹36.60, while resistance is seen around ₹42.70 and ₹44.74. Traders will closely watch whether the stock can sustain above the breakout zone in coming sessions.
FAQs
Why did RTNINDIA shares rise over 15% today?
The stock rallied after a technical breakout above its consolidation range and 50-day SMA.
Is RTNINDIA trading above its key moving average?
Yes, the stock is trading comfortably above its 50-day SMA of ₹33.41.
What levels should traders watch next?
Support is seen near ₹38.64 and ₹36.60, while resistance is located near ₹42.70 and ₹44.74.