
Highlights
- Rossell Techsys shares plunged more than 10% after a sharp multi-month rally.
- The stock witnessed heavy profit booking after recently touching record highs.
- Despite the decline, the stock remains above key medium-term trend levels.
Overview
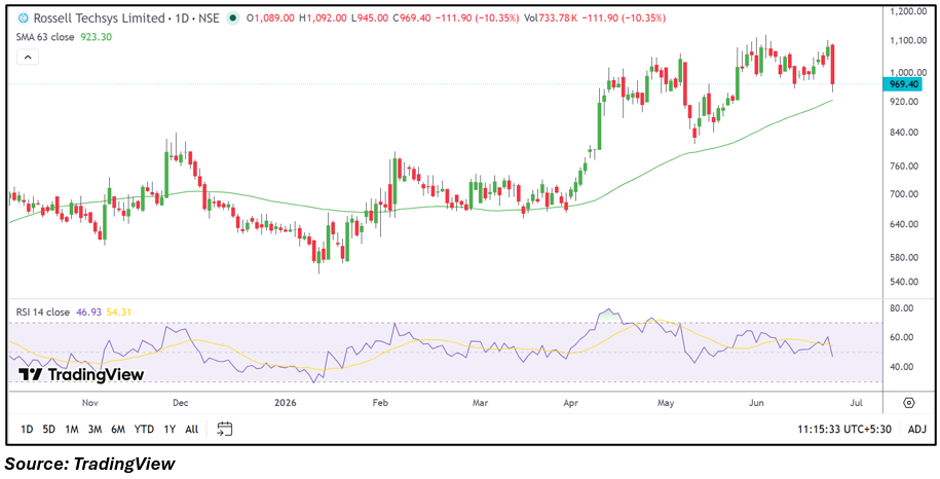
Rossell Techsys Limited (NSE: ROSSTECH) came under significant selling pressure on June 23, with the stock falling over 10% to ₹969.00 from the previous close of ₹1,081.30. The decline followed a strong rally over recent months that had pushed the stock to fresh highs above ₹1,090.00. Elevated trading activity alongside the sharp correction suggests traders may be locking in gains after the stock's substantial advance.
Fundamental View
For the quarter ended March 2026, Rossell Techsys reported standalone total income of ₹14,691.87 lakh. Profit before tax stood at ₹951.88 lakh, while net profit came in at ₹746.84 lakh. Earnings per share were reported at ₹1.98.
The company remains profitable, with its latest quarterly results reflecting positive earnings. However, the stock's valuation has expanded considerably following its recent rally, making it more vulnerable to short-term corrections whenever market participants choose to book profits.
Technical View
Rossell Techsys had been one of the stronger performers in recent months, supported by a sustained uptrend and a series of higher highs and higher lows. The latest session, however, saw a sharp reversal from recent peaks, resulting in a large bearish candle and a notable drop in momentum. RSI has moved lower from earlier elevated levels, indicating weakening near-term momentum. While the broader trend remains constructive, the current move reflects a clear cooling-off phase after an extended rally.
Key Technical Levels
The stock is currently trading near ₹969.00 after witnessing a sharp correction from recent highs around ₹1,092.00. Immediate support is placed near ₹940.00, followed by a stronger support zone around ₹900.00. On the upside, resistance is seen near ₹1,050.00, while a move above this level could bring the recent high zone around ₹1,100.00 back into focus. Price behaviour around these levels may determine whether the current decline remains a correction or develops into a deeper pullback.
Risks To Watch
- Continued profit booking after the recent rally.
- Volatility due to elevated market expectations.
- Valuation sensitivity following sharp price appreciation.
- Weakness in broader market sentiment impacting momentum stocks.
Summary
Rossell Techsys emerged among the NSE's notable losers after declining more than 10% from recent highs. The fall appears linked to profit booking following a strong multi-month rally that had lifted the stock significantly above earlier levels. Fundamentally, the company remains profitable, but the sharp correction highlights growing volatility after the recent surge. Investors will closely watch whether support zones hold as the stock attempts to stabilize after today's selloff.
FAQs
- Why did Rossell Techsys shares fall over 10% today?
The decline appears driven by profit booking after a strong rally that pushed the stock to fresh highs.
- Is Rossell Techsys still in an uptrend?
The broader trend remains positive, though the stock is undergoing a sharp short-term correction.
- What are the important levels to watch?
Support is near ₹940.00 and ₹900.00, while resistance is located around ₹1,050.00 and ₹1,100.00.