
Highlights
- Satin Creditcare shares jumped nearly 11% after the company reported FY26 earnings growth.
- Net profit for the March 2026 quarter stood at INR 16,204.57 lakh on a consolidated basis.
- Investors tracked improving profitability and continued momentum in microfinance-focused lenders.
Overview
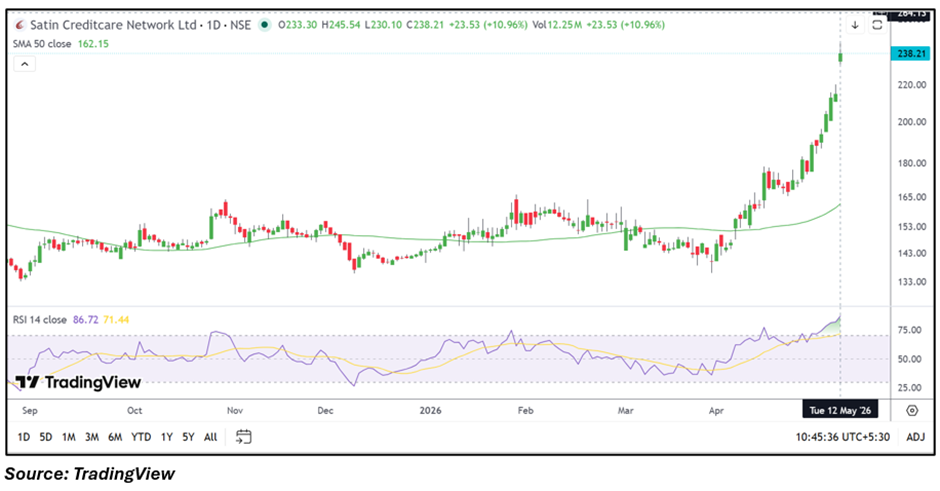
Satin Creditcare Network (NSE: SATIN) witnessed strong buying activity on May 12, with the stock rising nearly 10.98% to around INR 238.26 during intraday trade. The rally placed the microfinance-focused lender among the top gainers of the session following its latest quarterly earnings update.
The stock opened near INR 233.30 and touched an intraday high of INR 245.54 before consolidating near higher levels. Market participants appeared encouraged by the company’s profitability growth and improved earnings performance.
Earnings Performance Draws Investor Focus
For the quarter ended March 2026, Satin Creditcare reported consolidated total income of INR 92,255.11 lakh. Profit before tax stood at INR 21,215.91 lakh, while net profit came in at INR 16,204.57 lakh.
The company also reported earnings per share of INR 14.73 for the quarter. The latest numbers helped strengthen sentiment around the stock, especially as investors monitored recovery trends across select NBFC and microfinance counters.
Fundamental View
Satin Creditcare operates in the microfinance and financial inclusion segment, where credit demand trends, rural economic activity, collection efficiency, and funding costs remain important business drivers.
The latest earnings performance reflected profitability improvement, which supported positive sentiment in the counter. Investors may continue tracking asset quality trends and growth visibility in the coming quarters.
Technical View
Satin Creditcare is trading well above its 50-day SMA near INR 162.15, indicating a strong upward trend structure. The stock has also extended gains sharply over recent sessions, reflecting sustained momentum conditions.
The 14-day RSI moved near 86.72, suggesting the stock is trading in an elevated momentum zone after the recent rally. Price action indicates that volatility may remain high near current levels.
Key Technical Levels
- Immediate Support: INR 205.00–185.00
- Immediate Resistance: INR 260.00–280.00
Risks to Watch
- Elevated volatility may trigger sharp short-term swings.
- Asset quality pressures may impact future profitability.
- Rising funding costs could affect lending margins.
- Regulatory changes in microfinance may influence growth outlook.
Summary
Satin Creditcare shares extended their rally after the company reported improved FY26 earnings and profitability growth. The stock continued attracting investor attention amid positive sentiment in select NBFC and microfinance counters. While momentum remains strong, traders may closely watch sustainability of the rally as the stock approaches higher resistance zones after a sharp move in recent sessions.
FAQs
Why did Satin Creditcare stock rise today?
The stock gained after investors reacted positively to the company’s latest quarterly earnings and profitability growth.
What were Satin Creditcare’s latest quarterly earnings?
The company reported consolidated net profit of INR 16,204.57 lakh for the March 2026 quarter.
What are the important levels to watch for SATIN stock?
Support is placed near INR 205.00–185.00, while resistance stands around INR 260.00–280.00.