
Highlights
- SBC Exports shares declined more than 5% after recently touching fresh highs.
- The stock witnessed profit booking following a strong multi-month uptrend.
- Despite the correction, the broader price structure remains above key trend levels.
Overview
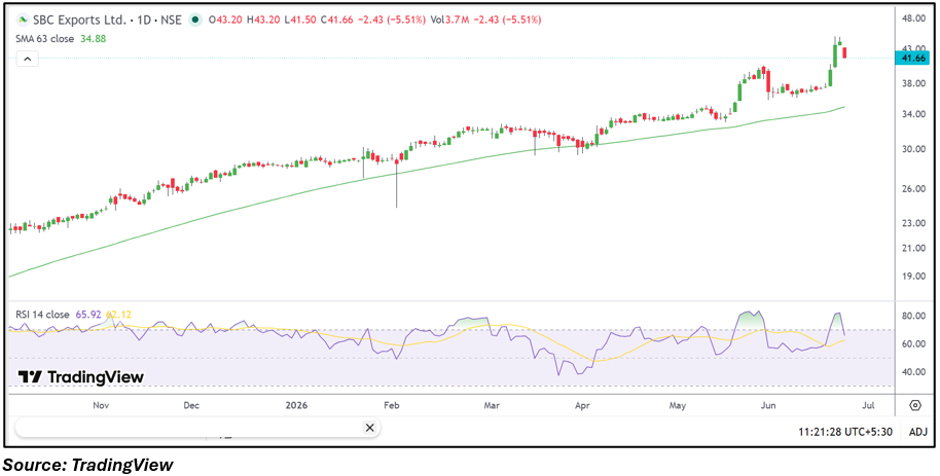
SBC Exports Limited (NSE: SBC) came under selling pressure on June 23, with the stock falling around 5.5% to ₹41.67 from the previous close of ₹44.09. The decline follows a sharp rally that pushed the stock to fresh highs near ₹44.50 in recent sessions. The pullback appears to be driven by profit booking as traders lock in gains after the stock’s sustained upward move over the past several months.
Fundamental View
For the quarter ended March 2026, SBC Exports reported standalone total income of ₹10,966.76 lakh. Profit before tax stood at ₹619.02 lakh, while net profit was also reported at ₹619.02 lakh. Earnings per share came in at ₹0.13.
The company remains profitable, and its latest financial performance reflects continued earnings generation. However, the stock trades in a segment where valuation expectations and momentum can significantly influence short-term price movements, particularly after extended rallies.
Technical View
SBC Exports has been trading in a well-defined upward trend for several months, consistently forming higher highs and higher lows. The latest session saw a sharp pullback from recent peaks, indicating near-term profit booking after the recent breakout move. Although momentum has cooled from elevated levels, the stock continues to trade above its medium-term trend support, suggesting that the broader bullish structure remains intact unless deeper selling pressure emerges.
Key Technical Levels
The stock is currently trading near ₹41.67 after retreating from its recent high zone around ₹44.50. Immediate support is placed near ₹40.00, followed by a stronger support area around ₹38.00. On the upside, resistance is seen near ₹44.50, while a sustained move above this level could open the path toward the ₹48.00 zone. Price action around these levels may determine whether the current weakness remains a temporary correction within the broader uptrend.
Risks To Watch
- Continued profit booking after the recent rally.
- Volatility associated with ASM-listed stocks.
- Valuation pressure following sharp price appreciation.
- Broader market weakness impacting momentum stocks.
Summary
SBC Exports shares declined more than 5% after recently touching fresh highs, reflecting profit booking following a sustained multi-month rally. The company remains profitable based on its latest quarterly results, while the stock continues to trade above important medium-term trend levels. Although the near-term momentum has weakened, market participants will closely monitor whether support zones hold as the stock consolidates after its recent advance.
FAQs
- Why did SBC Exports shares fall today?
The stock appears to be witnessing profit booking after reaching fresh highs following a strong rally.
- Is SBC Exports still in an uptrend?
The broader trend remains positive as the stock continues to trade above key medium-term support zones.
- What are the important levels to watch?
Support is near ₹40.00 and ₹38.00, while resistance is located around ₹44.50 and ₹48.00.