
Highlights
- SUVEN shares rallied over 7% and touched fresh multi-month highs on Tuesday.
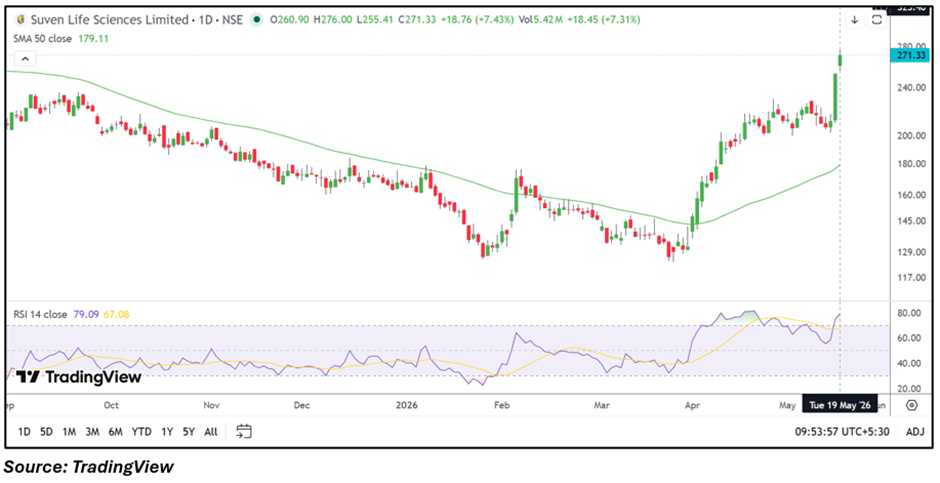
- The stock continued its sharp momentum move above the 50-day SMA near ₹179.11.
- Traders are now watching whether the rally can extend toward the ₹290–₹310 resistance zone.
Overview
Suven Life Sciences Limited (NSE: SUVEN) witnessed strong buying momentum on May 19, 2026, with the stock climbing more than 7% during the session. The counter opened at ₹260.90 and touched an intraday high of ₹276 before trading near ₹271.80.
The latest rally has extended the stock’s sharp recovery trend seen since April, with price action remaining firmly above key moving averages. Increased trading volumes and strong momentum indicators also supported the upside move.
Fundamental View
For the quarter ended March 2026, Suven Life Sciences reported consolidated total income of ₹829.79 lakh. The company posted a loss before tax of ₹4,559.55 lakh, while net loss stood at ₹4,559.55 lakh. Earnings per share came in at negative ₹2.02 for the quarter.
Despite continued losses, traders appear focused on momentum activity and the stock’s recent breakout structure. Market participants may continue tracking future developments related to the company’s research pipeline and financial performance.
Technical View
SUVEN stock remains in a strong short-term uptrend after reclaiming and sustaining above its 50-day SMA near ₹179.11. The stock has witnessed a sharp recovery from lower levels and is now trading close to recent swing highs.
The 14-day RSI near 79.09 has entered overbought territory, indicating strong momentum conditions but also pointing toward the possibility of near-term volatility. The current structure remains positive as long as the stock holds above immediate support zones.
Key Technical Levels
- Support Zone: ₹250–₹230
- Resistance Zone: ₹290–₹310
A sustained move above ₹290 may open the path toward higher resistance levels, while weakness below ₹250 could trigger profit-booking pressure.
Risks to Watch
- The company has remained loss-making for multiple quarters.
- Sharp rallies may increase short-term volatility risk.
- Failure to sustain above breakout levels may weaken momentum.
- Sector-wide risk-off sentiment could pressure pharma midcaps.
Summary
Suven Life Sciences shares extended their rally as bullish momentum continued across the counter despite ongoing losses in the latest quarter. The stock remains technically strong above key moving averages, while traders now monitor whether SUVEN can sustain momentum toward the ₹290–₹310 resistance range in the near term.
FAQs
- Why is SUVEN stock rising today?
SUVEN shares gained due to strong momentum, breakout continuation, and increased trading activity.
- What are the important support levels for SUVEN stock?
Key support levels for Suven Life Sciences are placed near ₹250 and ₹230.
- What resistance levels should traders monitor in SUVEN?
The stock may face near-term resistance around ₹290 and ₹310 levels.