
Highlights
- Tarsons Products shares climbed over 12% and entered the top gainers list.
- The stock witnessed a strong breakout above recent consolidation levels.
- Improved quarterly profitability and heavy trading volumes supported sentiment.
Tarsons Products Extends Sharp Upward Move
Tarsons Products Limited (NSE: TARSONS) witnessed strong buying activity on June 17, with the stock rising 12.49% to ₹268.54 during intraday trade. The rally pushed the stock to a fresh multi-month high and placed it among the top gainers on the NSE.
The sharp move came alongside a notable increase in trading volumes, indicating renewed market participation. After spending several weeks consolidating near the ₹200–₹240 range, the stock broke decisively above recent resistance zones, attracting momentum-driven interest.
Recent Financial Performance
For the quarter ended March 2026, Tarsons Products reported consolidated total income of ₹12,753.70 lakh. Profit before tax stood at ₹576.90 lakh, while net profit came in at ₹418.10 lakh. Earnings per share for the quarter was ₹0.79. The company remained profitable during the period, providing a fundamental backdrop to the improving sentiment in the stock.
Fundamental View
Tarsons Products operates in the laboratory and life sciences consumables segment, serving research institutions, healthcare facilities, pharmaceutical companies, and industrial laboratories. The latest quarterly results reflected continued profitability, although investors may continue monitoring earnings growth and margin trends. The stock currently trades at a relatively elevated valuation, with its trailing price-to-earnings ratio remaining above 50, making future earnings execution an important factor.
Technical View
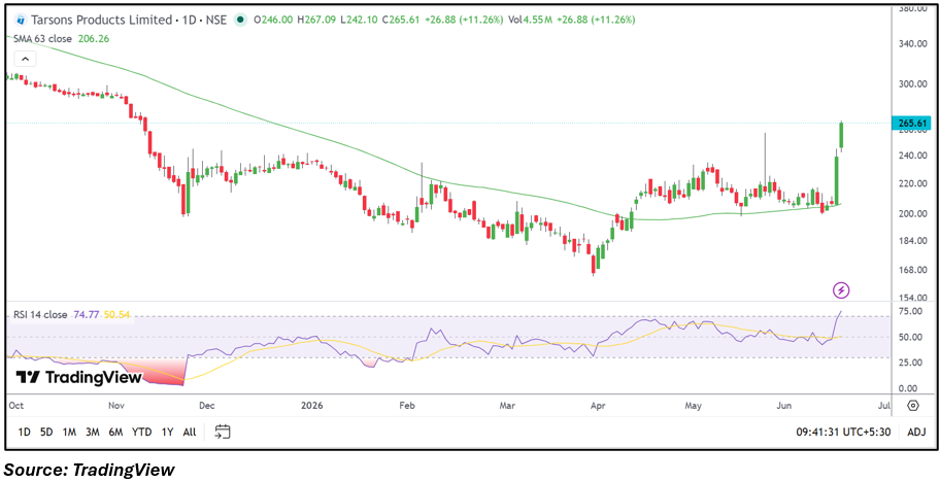
The technical structure has improved significantly following today's breakout. The stock has moved well above its 63-day moving average of ₹206.26 and has broken out from a prolonged consolidation phase. The RSI has surged near 75, reflecting strong momentum conditions. While momentum remains favorable, the sharp rise could also lead to short-term volatility as traders react to the extended move.
Key Technical Levels
Following the breakout, immediate support is now seen around ₹250, while a stronger support zone is positioned near ₹238, which previously acted as resistance. On the upside, the stock has entered relatively open territory, with the next resistance area emerging around ₹280, followed by ₹300. Sustaining above ₹250 would help maintain the current positive technical structure.
Risks to Watch
- Elevated valuation compared with earnings.
- Short-term volatility after a sharp breakout.
- Any slowdown in laboratory equipment demand.
- Profit-booking pressure after a strong rally.
Summary
Tarsons Products shares surged more than 12% as the stock broke out of a prolonged consolidation range on strong volume participation. The company remained profitable in the March 2026 quarter, while the technical setup improved considerably after the move above key resistance levels. Investors may closely monitor whether the stock can sustain above the breakout zone and maintain momentum in the coming sessions.
Frequently Asked Questions
- Why is Tarsons Products stock rising today?
The stock rallied after a strong technical breakout supported by increased trading volumes.
- Is Tarsons Products profitable?
Yes, the company reported a net profit of ₹418.10 lakh for the March 2026 quarter.
- What are the key levels to watch in TARSONS?
Support is near ₹250 and ₹238, while resistance is around ₹280 and ₹300.