
Highlights
- Vindhya Telelinks shares declined more than 7% after a sharp multi-month rally.
- The stock witnessed profit booking near recent highs after a strong upward move.
- Despite the correction, the broader trend remains positive above long-term support zones.
Overview
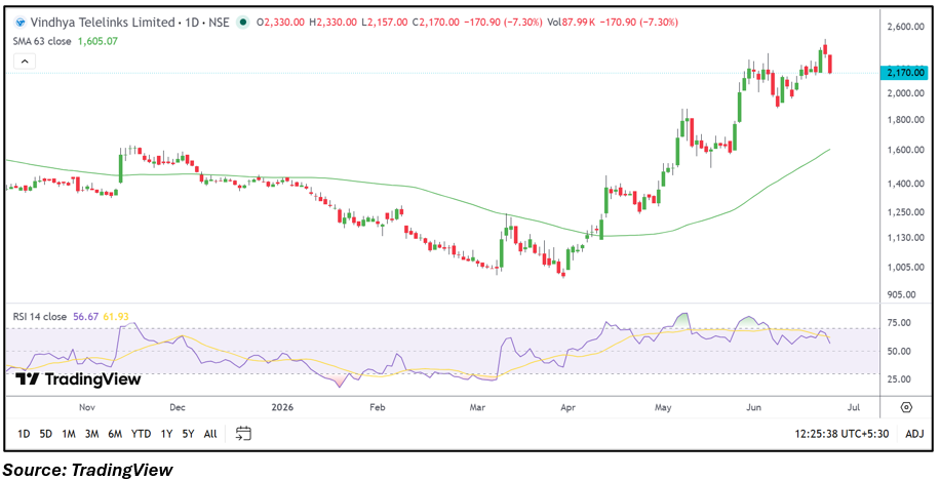
Vindhya Telelinks Limited (NSE: VINDHYATEL) came under selling pressure on June 23, with the stock falling over 7% to ₹2,171.50 from the previous close of ₹2,340.90. The decline follows a substantial rally that lifted the stock from levels near ₹1,000 earlier in the year to above ₹2,400 recently. The sharp pullback appears to reflect profit booking as traders lock in gains following the stock's impressive advance over recent months.
Fundamental View
For the quarter ended March 2026, Vindhya Telelinks reported standalone total income of ₹1,00,730.39 lakh. Profit before tax stood at ₹2,592.60 lakh, while net profit came in at ₹1,984.59 lakh. Earnings per share were reported at ₹16.75.
The company remains profitable and continues to generate earnings. However, after a significant rise in share price, market participants often reassess valuations and near-term growth expectations, which can contribute to periods of consolidation or correction.
Technical View
The stock has been one of the stronger performers in recent months, maintaining a clear pattern of higher highs and higher lows. However, the latest session saw a sharp bearish move after the stock approached recent highs. Momentum indicators have eased from elevated levels, suggesting that near-term enthusiasm has moderated. Even so, the broader trend structure remains constructive as the stock continues to trade well above its long-term trend support zone.
Key Technical Levels
The stock is currently trading near ₹2,171.50 after correcting from the recent high zone around ₹2,500.00. Immediate support is placed near ₹2,100.00, followed by a stronger support area around ₹2,000.00. On the upside, resistance is seen near ₹2,350.00, while a sustained move above this level could bring the recent high zone around ₹2,500.00 back into focus. The stock's reaction around these levels may determine whether the current weakness remains a short-term correction within the broader uptrend.
Risks To Watch
- Continued profit booking after the recent rally.
- Increased volatility due to ASM surveillance measures.
- Valuation pressure following sharp price appreciation.
- Broader market weakness affecting momentum stocks.
Summary
Vindhya Telelinks shares fell more than 7% as investors booked profits after a powerful rally that had driven the stock to multi-month highs. The company remains profitable based on its latest quarterly results, while the broader technical structure continues to Favor the long-term uptrend. However, the sharp correction highlights rising volatility, and traders will closely monitor whether key support zones hold during the current pullback.
FAQs
- Why did Vindhya Telelinks shares fall today?
The decline appears to be driven by profit booking after a substantial rally over the past several months.
- Is Vindhya Telelinks still in an uptrend?
The broader trend remains positive despite the recent correction, as the stock continues trading above major support levels.
- What are the important levels to watch?
Support is near ₹2,100.00 and ₹2,000.00, while resistance is located around ₹2,350.00 and ₹2,500.00.