
Highlights
- WENDT shares surged over 13% to enter the NSE top gainers list.
- The stock rallied above its 50-day SMA amid strong momentum.
- Recent quarterly profit and earnings growth remain in investor focus.
Overview
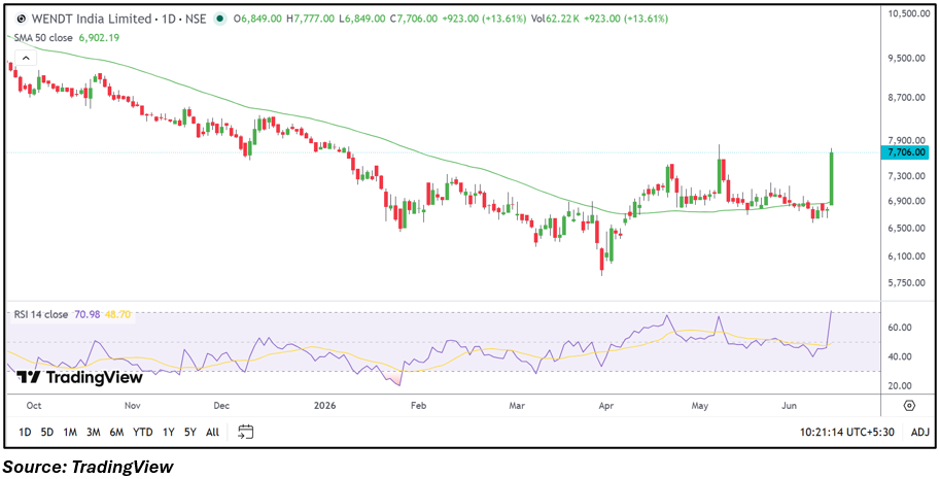
Wendt (India) Limited (NSE: WENDT) attracted strong investor attention on June 12 after its shares climbed 13.58% to ₹7,704.00. The sharp rally placed the stock among the top gainers on the NSE, supported by strong price action and increased market participation.
The stock opened at ₹6,849.00 and advanced to an intraday high of ₹7,777.00, reflecting renewed interest in the industrial abrasives and precision engineering company.
Fundamental View
For the quarter ended March 2026, Wendt reported consolidated total income of ₹6,796.00 lakh. Profit before tax stood at ₹784.00 lakh, while net profit came in at ₹509.00 lakh.
The company reported earnings per share of ₹25.45 during the quarter. The latest financial performance highlights continued profitability, which may be one factor supporting the positive market sentiment surrounding the stock.
Technical View
WENDT is trading at ₹7,704.00, up 13.58% for the session. The stock is trading comfortably above its 50-day SMA of ₹6,902.19, indicating an improvement in the medium-term trend structure.
Price action shows a strong breakout from the consolidation zone seen over recent weeks. The sharp upward move has pushed the stock toward levels last seen several months ago, placing it among the strongest performers of the day.
Momentum Indicator
The RSI is around 70.98 and has moved sharply higher, reflecting strong momentum. The indicator has entered the upper end of its range, suggesting traders may closely monitor whether the current momentum can be sustained after the sharp advance.
Key Technical Levels
WENDT is trading well above its 50-day SMA of ₹6,902.19, which now becomes an important reference level for the ongoing trend. On the upside, the stock has approached the ₹7,777.00 intraday high after today's breakout. Sustained trading above the recent breakout zone may help maintain momentum, while a move back toward the 50-day SMA could indicate consolidation after the sharp rally.
Risks to Watch
- Elevated valuation may increase volatility.
- Profit-booking could emerge after the sharp rise.
- Industrial demand cycles may affect earnings.
- Momentum could cool after a strong breakout.
Summary
Wendt (India) has emerged as one of the NSE's top gainers after rallying more than 13% in a single session. The stock's move above its 50-day SMA, strong price breakout, and profitable quarterly performance have helped attract investor attention. Market participants will now watch whether WENDT can sustain momentum near recent highs following the sharp advance.
FAQs
Why is WENDT stock rising today?
The stock gained sharply due to strong momentum, a technical breakout, and continued investor focus on its profitable financial performance.
What were WENDT's latest quarterly results?
The company reported consolidated net profit of ₹509.00 lakh and EPS of ₹25.45 for the March 2026 quarter.
What is the key level investors are watching?
The stock's position above its 50-day SMA near ₹6,902.19 remains important for the current trend.