
Highlights
- Rama Steel Tubes shares declined 15.19% during Monday’s trading session.
• December quarter net profit stood at INR 377.04 lakh.
• Investors tracked the stock after it slipped below key levels.
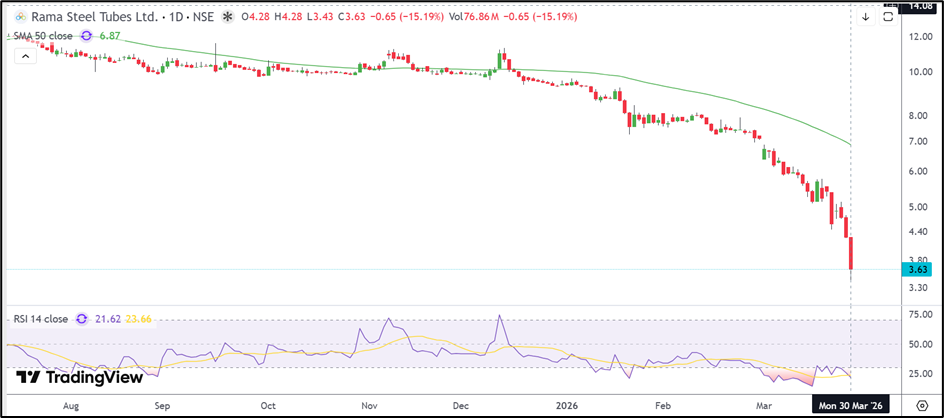
Rama Steel Tubes Ltd. (NSE: RAMASTEEL) moved sharply lower in the latest trading session, with the stock ending at INR 3.63, down 15.19% from its previous close of INR 4.28. The stock opened at INR 4.28 and remained under pressure through the session, touching an intraday low of INR 3.43. The day’s high also stood at INR 4.28, while the volume-weighted average price for the session was recorded at INR 3.86.
The latest decline placed the stock among the top losers on the exchange. The scrip also remains in focus because its high-low price variation exceeded 75.00% during the previous one month and more than 150.00% during the previous three months.
Fundamental View: December Quarter Profit Fails To Support Sentiment
For the quarter ended December 31, 2025, Rama Steel Tubes reported standalone total income of INR 24,680.76 lakh. Profit before tax stood at INR 495.76 lakh, while net profit came in at INR 377.04 lakh. Earnings per share for the quarter was reported at INR 0.02.
Despite remaining profitable during the quarter, the share price continued to weaken. Investors appear to have reassessed the stock after the recent decline, while concerns around volatility and near-term demand conditions continued to affect sentiment.
Technical View: Sharp Breakdown Extends Broader Downtrend
The broader structure in Rama Steel Tubes remains weak, with the stock continuing to trade in a downtrend phase. The latest session pushed the stock down to INR 3.63 after it failed to hold above the earlier support zone near INR 4.28.
The decline has also widened the gap below the 50-day Simple Moving Average near INR 6.87, indicating that the broader structure remains under pressure. Price action continues to reflect lower highs and lower lows, while the latest sharp fall suggests that downside momentum has intensified.
Momentum Indicator Moves into Oversold Territory
The 14-day RSI has slipped to around 21.62, moving into oversold territory. This indicates that momentum remains weak after the recent decline, although such readings may also lead to short-term stabilisation.
Key Technical Levels
At INR 3.63, immediate support is now seen near INR 3.20, followed by stronger downside support around INR 2.80. On the upside, resistance is placed near INR 4.28–4.60.
A move back above INR 4.28 may help stabilise the recent decline, while the 50-day moving average near INR 6.87 remains a higher resistance zone.
Source: TradingView
Key Risks
- Failure to hold above INR 3.20 may extend the decline.
• High price volatility may keep trading conditions unstable.
• Resistance near INR 4.28–4.60 could restrict recovery.
• Weak momentum may continue to affect investor sentiment.
Summary
Rama Steel Tubes shares fell 15.19% to INR 3.63 after extending their recent decline and slipping below INR 4.28. Despite reporting December quarter net profit of INR 377.04 lakh, the stock remains under pressure. Support is placed near INR 3.20–2.80, while resistance is seen around INR 4.28–4.60. Investors are likely to monitor whether the stock can stabilise above support.
FAQs
- Why did Rama Steel Tubes shares fall 15.19%?
The stock declined after slipping below the INR 4.28 support zone.
- What was Rama Steel Tubes’ December quarter net profit?
The company reported standalone net profit of INR 377.04 lakh.
- Which price levels are important for RAMASTEEL shares?
Support is near INR 3.20–2.80, while resistance is around INR 4.28–4.60.