
The Indian stock market remained weak on March 27, 2026, with several major stocks closing lower due to continued selling pressure. Among the top losers, Shriram Finance declined the most, falling by 4.98%. TMPV also dropped by 4.80%, while Reliance Industries slipped 4.29%. Bajaj Finance saw a fall of 4.06%, followed by IndiGo which declined 3.76%, and Bajaj Finserv which was down 3.42%. Overall, the market sentiment stayed negative as most key stocks ended the day in the red.
Nifty SmallCap 100 Index Shows Weak Trend
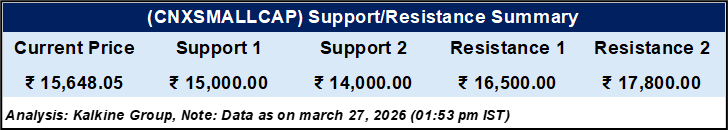
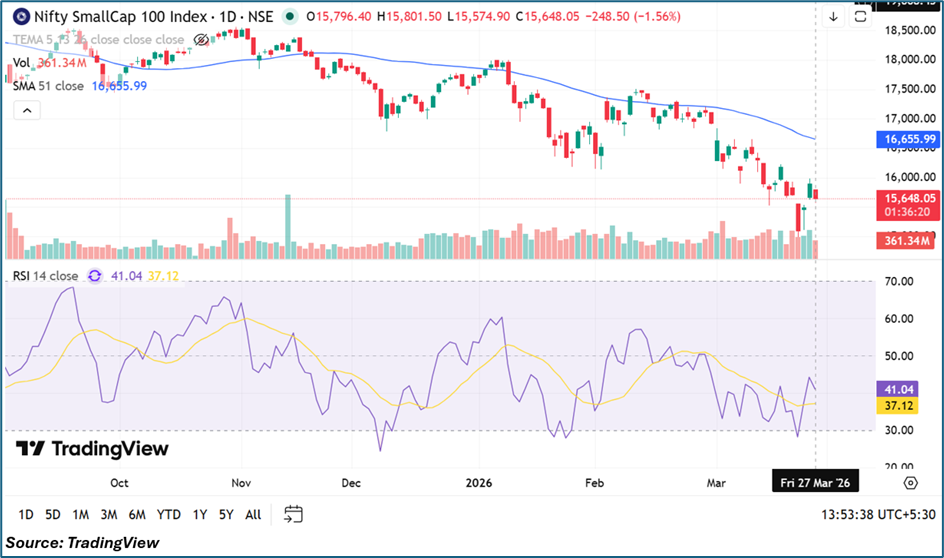
The Nifty SmallCap 100 index also remained under pressure and closed around 15,648.05. Technically, the index is trading below its 51-day Simple Moving Average of 16,655.99, which signals a continuing downtrend. The chart pattern shows lower highs and lower lows, which means the weakness in small-cap stocks is still strong.
Momentum indicators are also not very supportive. The 14-day RSI is near 41.04, showing that buying strength is weak and the index is struggling to recover.
In the short term, important support levels are around 15,000 and 14,000. On the upside, resistance is seen near 16,500 and 17,800. These levels will be important to watch for any trend change.
Nifty MidCap 100 Index Under Selling Pressure
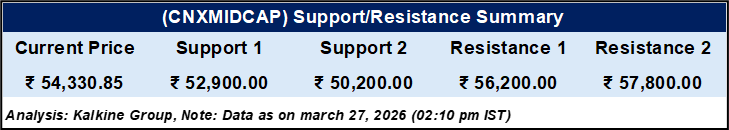
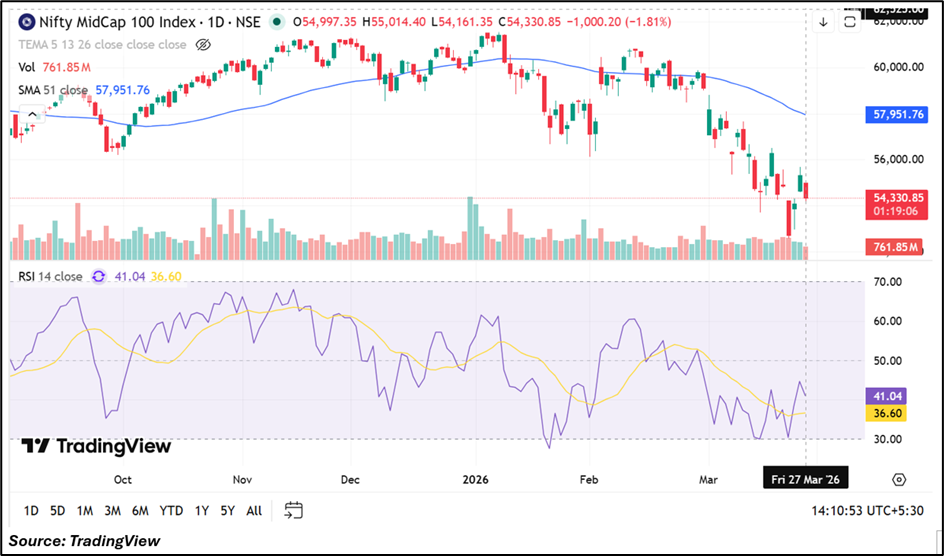
The Nifty MidCap 100 index also followed a similar trend and fell to around 54,330.85. It is trading below its 51-day Simple Moving Average of 57,951.76, which confirms a bearish trend in the mid-cap segment.
The price pattern again shows lower highs and lower lows, indicating strong selling pressure. The 14-day RSI is around 41.04, which shows that the market lacks strong buying interest even though prices are trying to stabilize.
For the near term, support is placed at 52,900 and 50,200. On the higher side, resistance levels are around 56,200 and 57,800. These levels will act as key points for the next move.
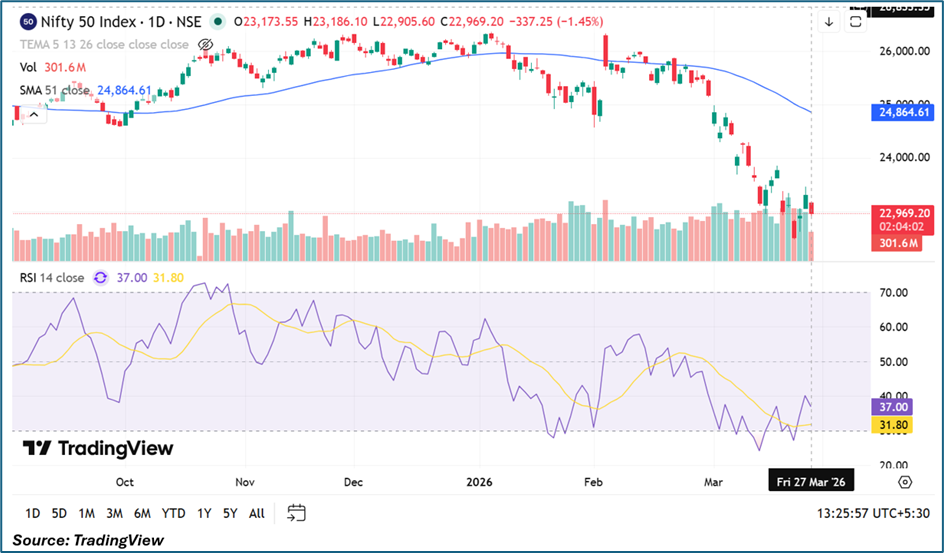
Nifty 50 Index Remains Weak
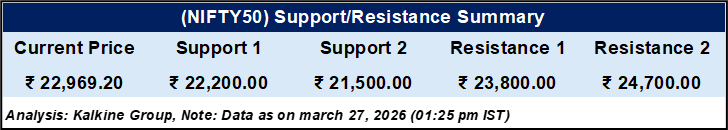
The Nifty 50 index closed at 22,969.20 and continues to trade well below its 51-day SMA of 24,864.61. This clearly shows that the overall market trend remains downward.
The index is forming lower highs and lower lows, which indicates continuous selling in the market. The 14-day RSI is near 37.00, which suggests the index is close to oversold levels but has not yet shown any strong reversal signs.
In the near term, key support levels are at 22,200 and 21,500. On the upside, resistance is placed near 23,800 and 24,700. These levels will be important to determine the market direction in the coming days.
Outlook
The overall market outlook remains cautious as weakness continues across all segments. The current trend suggests that selling pressure may persist in the near term unless strong buying interest returns. However, some indices are approaching key support levels, which could lead to short-term stability or a minor bounce. Investors should closely watch important support and resistance levels for clearer direction. Any recovery will likely depend on improved market sentiment and sustained buying activity. Until then, the market is expected to remain volatile with a slightly bearish bias.