
Highlights
- Steel Authority of India Limited (NSE: SAIL) traded near INR 159.52 on 7 April 2026.
- The stock remains above its 50-day Simple Moving Average near INR 155.44.
- December 2025 quarter net profit stood at INR 37,403.00 lakh.
Steel Authority of India Limited (NSE: SAIL) remained largely stable in Tuesday’s session, trading near INR 159.52, down 0.57% from the previous close of INR 160.44. The stock opened at INR 159.42 and moved between an intraday high of INR 160.99 and a low of INR 158.55. VWAP for the session stood at INR 159.81.
Despite the modest decline, Steel Authority of India Limited (NSE: SAIL) continues to hold above its 50-day Simple Moving Average near INR 155.44. The stock has gradually recovered from the March weakness and is now attempting to move back toward the upper end of its recent trading range.
Fundamental View
For the quarter ended 31 December 2025, Steel Authority of India Limited (NSE: SAIL) reported consolidated total income of INR 27,54,593.00 lakh. Profit before tax stood at INR 40,607.00 lakh, while net profit came in at INR 37,403.00 lakh. Earnings per share for the quarter was INR 0.91.
The latest quarterly numbers indicate that Steel Authority of India Limited (NSE: SAIL) continues to maintain strong profitability despite fluctuations in steel prices and demand conditions. Healthy earnings and a stable balance sheet continue to support the longer-term outlook.
Technical View
Steel Authority of India Limited (NSE: SAIL) is currently trading near INR 159.52 and remains above its 50-day Simple Moving Average near INR 155.44. The chart shows that the stock has formed a higher-low structure after rebounding from the INR 145.00 region.
Recent price action suggests that buyers are gradually regaining control, with the stock moving higher after holding above the moving average. The latest recovery has also pushed the stock back toward the INR 160.00 zone, which had acted as a hurdle during the previous phase.
The 14-day RSI stands near 56.01, indicating that momentum remains positive and is gradually improving. As long as Steel Authority of India Limited (NSE: SAIL) remains above the INR 145.00 area, the broader trend may continue to stay constructive.
If the stock manages to move decisively above the INR 175.00 region, the ongoing rebound may strengthen further and open the possibility of an extended upmove.
Key Technical Levels
Immediate support is seen near INR 145.00, followed by a stronger downside zone around INR 130.00. On the upside, the stock may face resistance near INR 175.00, while a stronger breakout zone is placed around INR 195.00.
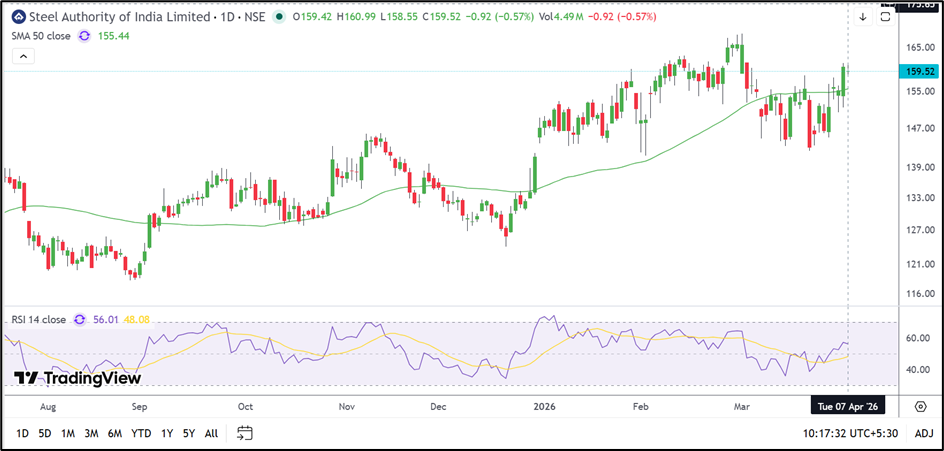
Source: TradingView
Risks To Watch
- Failure to hold above INR 145.00 may weaken the rebound.
- Resistance near INR 175.00 could delay further upside.
- Weakness in global steel prices may affect sentiment.
- Broader market volatility could slow the recovery trend.
FAQs
- Why is Steel Authority of India Limited (NSE: SAIL) looking bullish?
The stock is trading above its 50-day moving average and has formed a higher-low structure after rebounding from INR 145.00. - What was Steel Authority of India Limited’s December 2025 net profit?
The company reported consolidated net profit of INR 37,403.00 lakh. - What are the important levels to watch in Steel Authority of India Limited (NSE: SAIL)?
Support is placed near INR 145.00–130.00, while resistance remains near INR 175.00–195.00.