
Company Overview
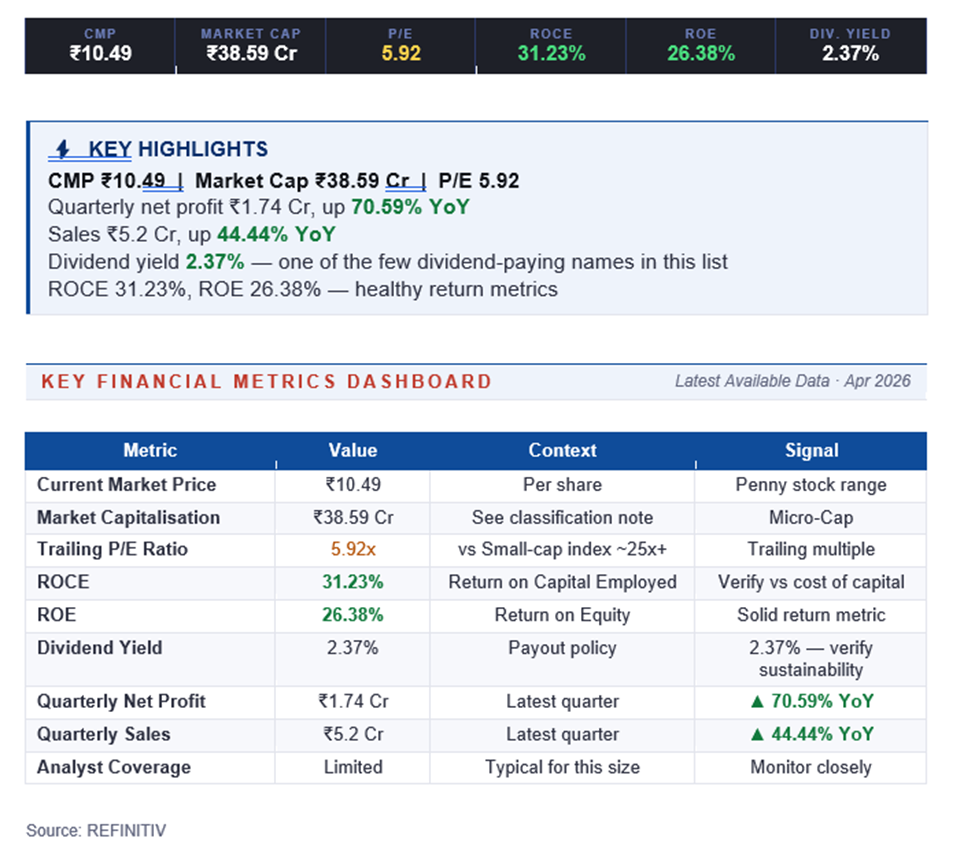
JMJ Fintech is a small-cap Indian listed entity positioned within the broader financial services and fintech space. With a market capitalisation of ₹38.59 crore and a share price of ₹10.49, the company sits in the micro-cap category. India's fintech landscape has expanded rapidly over the past decade, driven by digital payments adoption, NBFC formalisation, and growing credit penetration in semi-urban and rural markets.
The financial signature visible in the sheet data — 70% profit growth, 44% sales growth, and 2.37% dividend yield — is an unusual combination. Most high-growth small-caps suspend dividends entirely to fund expansion. JMJ's decision to maintain a payout while growing rapidly suggests either a balance-sheet-heavy model that generates surplus cash, or management's explicit philosophy of maintaining consistent shareholder distributions alongside reinvestment.
Price Performance
At ₹10.49 with a ₹38.59 crore market cap, JMJ trades in a price and liquidity band where volatility is material but not extreme. The micro-cap status means the stock will be sensitive to broader small-cap sentiment, any change in fintech regulation, and, given the dividend, to the dividend calendar as well.
Investors should monitor delivery volumes, short-term price trends around quarterly results, and any disclosures related to RBI or SEBI regulatory action on fintech peers.
Shareholder Returns
JMJ Fintech offers a 2.37% dividend yield — the highest among the stocks in this cluster. This provides a small but real cash return independent of capital appreciation. Combined with double-digit profit growth, the total-return profile (dividend plus appreciation) is more balanced than pure-growth peers.
Investors should verify that the dividend is funded by operating cash flow, not debt or asset sales — a basic check using the cash flow statement.
Financials
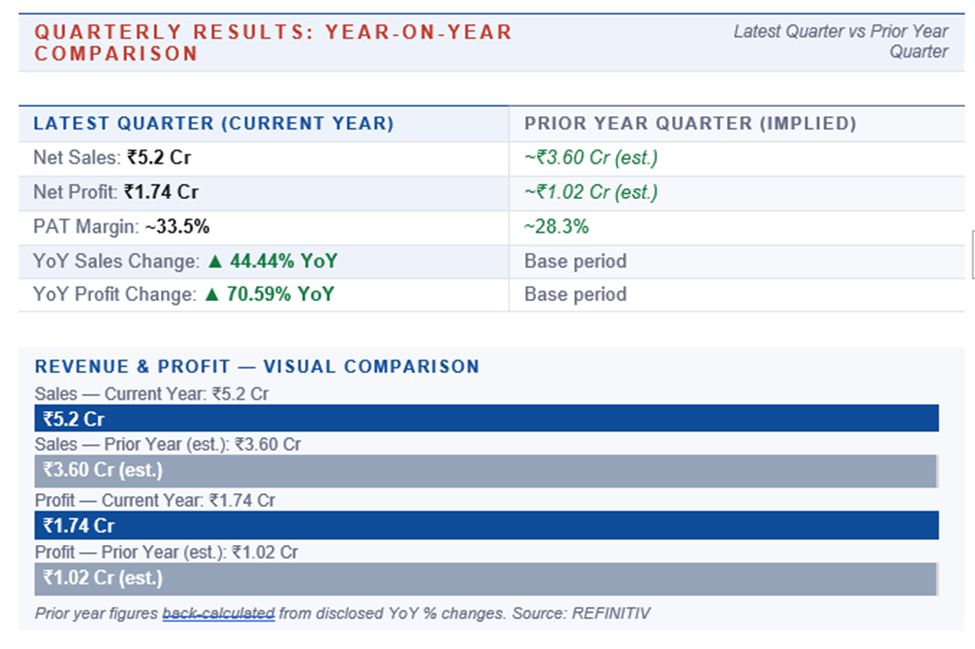
The latest quarter shows healthy growth on both lines. Quarterly net profit rose 70.59% YoY to ₹1.74 crore, on quarterly sales of ₹5.2 crore (up 44.44% YoY). Profit growth outpacing sales growth points to operating leverage — encouraging in a small business scaling up.
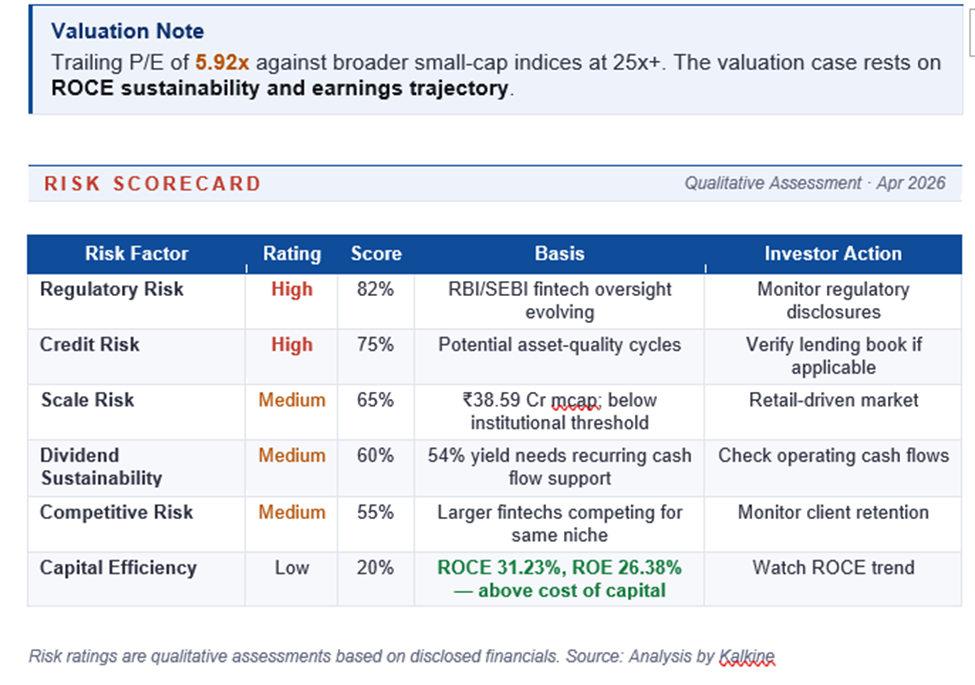
Trailing ROCE of 31.23% and ROE of 26.38% indicate efficient use of capital, well above the cost of equity for Indian small-caps. The P/E of 5.92 is a modest multiple for a business growing profits at 70%, giving a PEG ratio well under 0.1. However, the absolute revenue base of ₹5.2 crore quarterly is small — investors should be alert to lumpy revenue recognition.
Risks
- Regulatory risk: Fintech in India is evolving under RBI and SEBI oversight; any tightening of lending norms, digital-payment rules, or KYC requirements can impact business models.
- Credit risk: If the business has a lending component, asset quality cycles will drive earnings volatility independent of revenue growth.
- Competitive risk: The fintech space has seen heavy capital deployment by larger private and listed peers; defending niche positioning is an ongoing challenge.
- Dividend sustainability risk: A 2.37% yield needs to be supported by recurring cash flow; any compression in earnings could force a dividend cut, which tends to trigger disproportionate price impact.
Business Strategy
Inferring strategy from the numbers, JMJ appears to be pursuing a balanced approach: growing rapidly while maintaining enough cash discipline to distribute dividends. This is a mature posture that differs from typical high-growth fintech peers.
The strategic tests are: (1) can the company continue to grow revenue 40%+ while maintaining dividends, (2) is the fintech niche defensible against larger players, and (3) can the business move up-market to larger ticket sizes without compromising asset quality.
Valuation
The valuation picture is favourable on paper: P/E of 5.92 against 70%+ profit growth implies a deeply discounted PEG ratio, and a 2.37% dividend yield provides a cushion. Comparable Indian NBFCs and fintechs typically trade at 12–25x earnings, making JMJ look inexpensive even after discounting for size.
A re-rating would require two to three quarters of consistent growth, dividend persistence, and no regulatory surprises. For patient investors comfortable with small-cap volatility, JMJ offers an interesting blend of growth, yield, and valuation.
Frequently Asked Questions
What does JMJ Fintech do?
JMJ operates in the financial services and fintech space. Specific business lines should be verified from the company's annual report and exchange filings.
Is JMJ Fintech a good dividend stock?
With a 2.37% dividend yield combined with 70% profit growth, JMJ is one of the few penny stocks offering both yield and growth. However, micro-cap risks apply.
What's the market cap of JMJ Fintech?
Approximately ₹38.59 crore — a micro-cap entity.
Why is the P/E so low?
The P/E of 5.92 reflects the market's discount for micro-cap size, fintech-sector regulatory risk, and the need to confirm that the recent growth rate is sustainable.
What are the key risks?
Fintech regulation (RBI/SEBI), credit risk if lending is involved, competitive pressure from larger fintechs, micro-cap liquidity, and dividend sustainability.