
Successful investing is not just about identifying promising companies—it is also about understanding the numbers behind the business. Whether you’re a beginner entering the stock market or an investor looking to improve your research process, knowing how to interpret key financial ratios can help you make more informed investment decisions.
Among the most widely used metrics in fundamental analysis are the Price-to-Earnings (PE) Ratio, Price-to-Book (PB) Ratio, Return on Equity (ROE), and Return on Capital Employed (ROCE). These indicators provide valuable insights into a company’s valuation, profitability, and operational efficiency.
Understanding these financial metrics can help investors separate strong businesses from weaker ones and avoid common investment mistakes.
Why Financial Ratios Matter
Financial ratios allow investors to evaluate a company’s performance beyond its stock price. They help answer important questions such as:
- Is the stock overvalued or undervalued?
- How efficiently does the company generate profits?
- Is management using shareholder capital effectively?
- Does the business generate strong returns on its investments?
By combining multiple ratios rather than relying on a single metric, investors can gain a more comprehensive view of a company’s financial health.
Understanding the PE Ratio
What Is the PE Ratio?
The Price-to-Earnings (PE) Ratio measures how much investors are willing to pay for every rupee of a company’s earnings.
Formula
PE Ratio = Market Price Per Share ÷ Earnings Per Share (EPS)
Example
Suppose a company’s stock is trading at ₹500 and its Earnings Per Share (EPS) is ₹25.
PE Ratio = 500 ÷ 25 = 20
This means investors are willing to pay ₹20 for every ₹1 of earnings generated by the company.
What Does It Indicate?
- A higher PE ratio may indicate strong future growth expectations.
- A lower PE ratio may suggest undervaluation or slower growth prospects.
However, PE ratios should always be compared with industry peers rather than viewed in isolation.
Understanding the PB Ratio
What Is the PB Ratio?
The Price-to-Book (PB) Ratio compares a company’s market value with its book value, which represents the net value of its assets after liabilities.
Formula
PB Ratio = Market Price Per Share ÷ Book Value Per Share
Example
If a stock trades at ₹200 and its book value per share is ₹100:
PB Ratio = 200 ÷ 100 = 2
This means investors are paying two times the company’s book value.
What Does It Indicate?
- A PB ratio below 1 may suggest undervaluation.
- A higher PB ratio may indicate strong growth expectations.
The PB ratio is particularly useful when evaluating banks, financial institutions, and asset-heavy businesses.
Understanding ROE
What Is ROE?
Return on Equity (ROE) measures how effectively a company generates profits using shareholders’ funds.
Formula
ROE = Net Profit ÷ Shareholders’ Equity × 100
Example
If a company earns ₹100 crore in net profit and has shareholder equity of ₹500 crore:
ROE = (100 ÷ 500) × 100 = 20%
This means the company generates ₹20 in profit for every ₹100 invested by shareholders.
Why ROE Matters
Higher ROE often indicates:
- Efficient management
- Strong profitability
- Effective use of shareholder capital
Consistently high ROE levels are commonly associated with quality businesses.
Understanding ROCE
What Is ROCE?
Return on Capital Employed (ROCE) measures how efficiently a company generates profits from its total capital base, including both debt and equity.
Formula
ROCE = EBIT ÷ Capital Employed × 100
Example
If a company reports EBIT of ₹150 crore and capital employed of ₹1,000 crore:
ROCE = (150 ÷ 1,000) × 100 = 15%
Why ROCE Matters
ROCE is particularly useful for comparing companies in capital-intensive sectors such as:
- Manufacturing
- Infrastructure
- Energy
- Industrials
A consistently strong ROCE may indicate efficient operations and effective capital allocation.
ROE vs ROCE: What’s the Difference?
Many investors confuse ROE and ROCE, but they measure different aspects of performance.
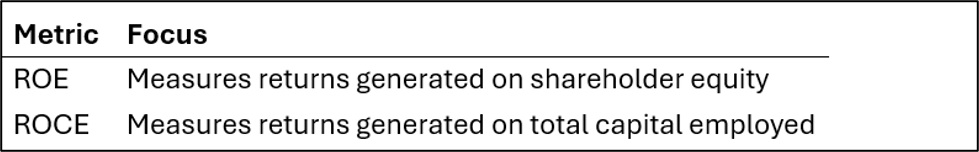
While ROE focuses on shareholders’ funds, ROCE provides a broader assessment by including debt capital.
For businesses with significant borrowing, ROCE often provides a more complete picture of operational efficiency.
How Investors Can Use These Ratios Together
No single financial ratio can provide a complete investment picture.
A strong company often demonstrates:
- Reasonable PE valuation
- Healthy PB ratio
- Consistently high ROE
- Strong ROCE
- Sustainable earnings growth
Combining these metrics with industry analysis and qualitative factors can improve investment decision-making.
Common Mistakes Investors Should Avoid
Looking at One Ratio in Isolation- A low PE ratio does not automatically mean a stock is attractive.
Ignoring Industry Comparisons- Financial ratios vary significantly across sectors.
Focusing Only on Valuation- A cheap stock with weak fundamentals may remain underperforming for extended periods.
Ignoring Growth Prospects- Strong financial ratios should be supported by sustainable business growth.
Final Thoughts
PE Ratio, PB Ratio, ROE, and ROCE are among the most important tools in an investor’s toolkit. These metrics provide valuable insights into a company’s valuation, profitability, and efficiency.
While no single ratio guarantees investment success, understanding how these indicators work together can help investors evaluate businesses more effectively and make better long-term investment decisions.
Frequently Asked Questions (FAQs)
1. What is a good PE ratio for a stock?
A good PE ratio varies by industry. Investors should compare a company’s PE ratio with its sector peers and historical averages.
2. Why is the PB ratio important?
The PB ratio helps investors assess whether a stock is trading above or below its book value and is particularly useful for financial institutions.
3. What is considered a strong ROE?
Many investors consider ROE above 15% as a positive indicator, although benchmarks differ across industries.
4. Why is ROCE important?
ROCE measures how efficiently a company generates returns from both debt and equity capital.
5. Which is better: ROE or ROCE?
Both metrics serve different purposes. ROCE often provides a broader view of capital efficiency, especially for companies with significant debt.
6. Can a stock have a low PE ratio but still be risky?
Yes. A low PE ratio may reflect underlying business challenges or weak growth prospects.
7. Should investors rely solely on financial ratios?
No. Financial ratios should be used alongside business analysis, industry research, management evaluation, and growth assessment.