
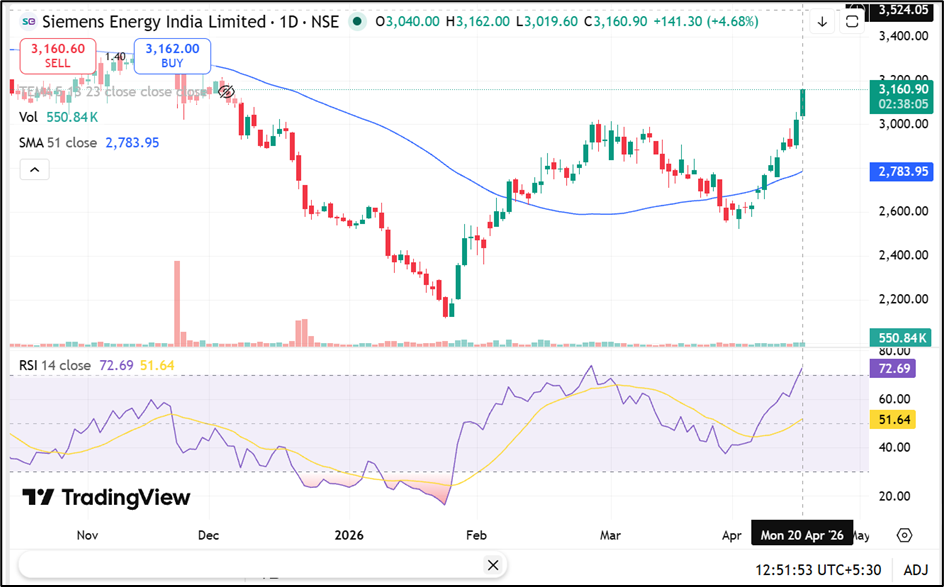
Shares of Siemens Energy India Limited (NSE:ENRIN) were trading at INR 3,153.60 on April 20, 2026, up 4.44% from the previous close of INR 3,019.60. The stock opened at INR 3,040.00 and touched a high of INR 3,160.00, while the day’s low was INR 3,019.60.
The price staying near the day’s high suggests that buying interest remained steady throughout the session.
Volatility and Price Range
The stock’s 52-week high is INR 3,625.00 and the low is INR 2,115.00. The current price is below the upper band of INR 3,623.50 but above the lower band of INR 2,415.70.
Daily volatility is 1.71%, and annualised volatility is 32.67%. This shows that the stock has moderate price movements over time.
Performance Compared to the Market
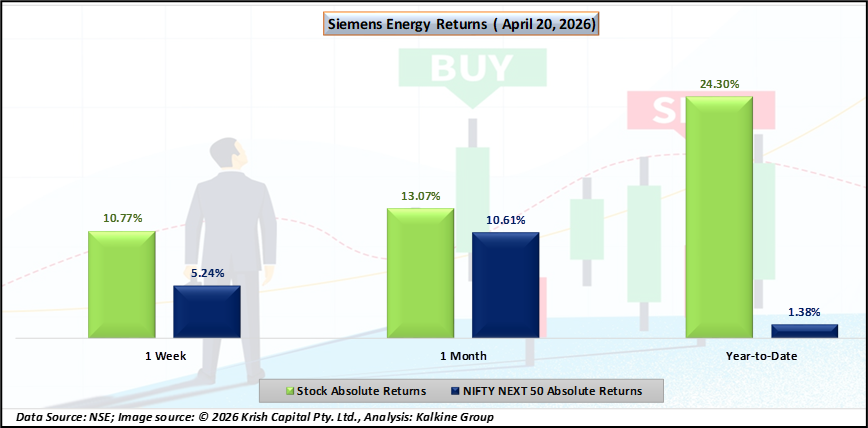
Siemens Energy India has performed better than the NIFTY NEXT 50 in the short term. The stock gained 10.77% in one week and 13.07% in one month, compared to 5.24% and 10.61% for the index.
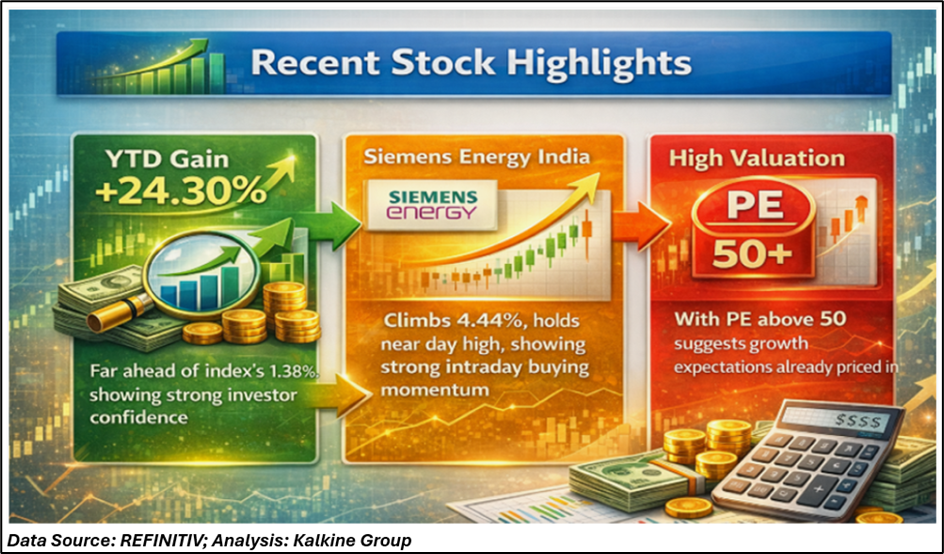
On a year-to-date basis, the stock is up 24.30%, while the index gained only 1.38%. However, longer-term data like one-year or five-year returns is not available because the company was incorporated in 2024.
Business Overview
Siemens Energy India Limited (NSE:ENRIN) works in the energy technology sector. It provides solutions across power generation, transmission, and energy storage. The company covers a wide part of the energy value chain, including power and heat generation systems.
The business is linked to changing energy needs and development in power infrastructure.
Valuation and Market Size
The company has a market capitalisation of INR 1,12,316.85 crore and a free float market cap of INR 27,812.73 crore.
The stock is trading at a PE ratio above 50 for the last four quarters. This shows that the valuation is relatively high compared to earnings.
About 49.06% of the traded shares were deliverable, which indicates a mix of short-term and longer-term participation.
Technical summary
Siemens Energy India (NSE:ENRIN) is trading near ₹3,160.90, up around 4.68%, and has surged significantly above the 51-day SMA near ₹2,783.95, while the 14-day RSI near 72.69 points. Immediate support is placed in the ₹2,900.00–2,780.00 zone, while resistance is seen near the ₹3,350.00–3,500.00 range.
Key Risks
- High valuation may limit further price increase if earnings do not grow.
- Higher sell orders in the market may create short-term pressure.
- Limited past data makes long-term analysis difficult.
- Price volatility may increase during overall market weakness.
Summary
Siemens Energy India (NSE:ENRIN) stock rose 4.44% with active trading and short-term outperformance compared to the benchmark index. The price stayed near the day’s high, showing steady demand.
However, high valuation and higher sell orders may affect near-term movement. Limited historical data and moderate volatility suggest that investors may watch price trends and broader market conditions closely.
FAQs
- Why did Siemens Energy India stock increase today?
The stock increased due to active trading, steady buying interest, and price movement near the day’s high levels. - How has Siemens Energy India performed compared to the index?
The stock has outperformed the NIFTY NEXT 50 in short-term periods like one week, one month, and year-to-date. - What does a high PE ratio mean for investors?
A high PE ratio means the stock is valued higher compared to earnings, which may depend on future growth expectations.