
📌 Key Highlights
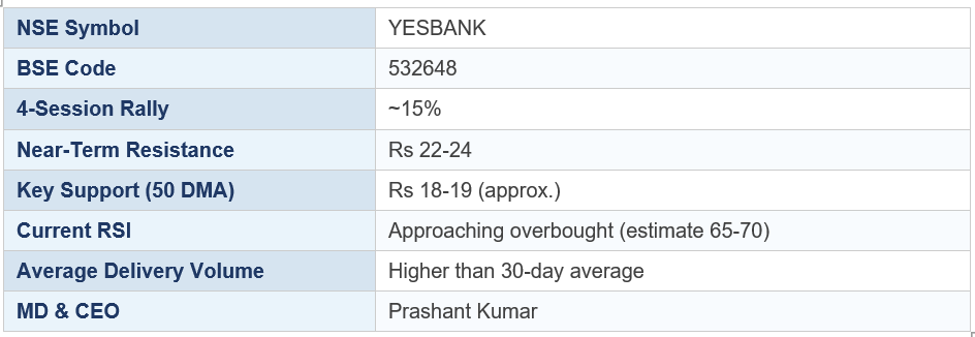
- Yes Bank (NSE: YESBANK) shares up ~15% across four consecutive trading sessions
- Technical indicators signal momentum buildup — RSI approaching overbought zone
- Key resistance levels to watch: Rs 22-24 range (near-term); Rs 28-30 (medium-term)
- Support levels: Rs 18-19 (50-day SMA); Rs 16-17 (200-day SMA)
- Volume surge accompanying the rally suggests institutional participation
- Bank's fundamental turnaround under MD & CEO Prashant Kumar continues — NPAs declining
- SBI-led reconstruction plan (2020) and RBI restrictions now largely behind the bank
📋 Quick Facts
📰 The Story
Yes Bank's shares have surged approximately 15% across four trading sessions, catching the attention of traders and investors with a strong volume-backed momentum rally. The move has prompted technical analysts to examine chart patterns, oscillators, and volume data to assess whether this represents the beginning of a sustained uptrend or a short-covering bounce ahead of a potential consolidation.
Yes Bank (NSE: YESBANK, BSE: 532648) has had one of the most dramatic journeys of any large Indian private sector bank in recent memory. Following a near-collapse in 2020 — triggered by a surge in non-performing assets, governance failures, and a liquidity crisis — the RBI orchestrated a reconstruction scheme led by the State Bank of India, which infused capital and stabilised the bank. The subsequent years have been characterised by a slow but methodical turnaround under MD & CEO Prashant Kumar.
From a technical perspective, the four-session rally appears to have been triggered by a breakout above the Rs 19-20 resistance zone — a level that had capped multiple prior recovery attempts. The breakout, accompanied by above-average trading volumes, is technically interpreted as a bullish signal indicating that buyers are willing to absorb supply at higher price levels. The stock's Relative Strength Index (RSI) is estimated to have climbed to the 65-70 range — elevated but not yet in the 70+ overbought territory that typically signals near-term reversal risk.
Momentum indicators such as the Moving Average Convergence Divergence (MACD) line crossing above the signal line in recent sessions add technical conviction to the bullish case. The price is trading above its 50-day Simple Moving Average (SMA), which now acts as near-term support at approximately Rs 18-19. The 200-day SMA, a longer-term trend indicator, sits at approximately Rs 16-17 — well below current prices, suggesting the longer-term trend has turned constructive.
From a fundamental perspective, the ongoing turnaround is real but incomplete. Yes Bank has been reporting improving asset quality metrics — Gross NPA ratios have declined from their post-crisis peaks and Net NPAs are progressively being provided for. Net interest margins (NIMs), while improving, remain below those of leading private sector peers. The bank's CASA ratio has stabilised and low-cost deposits are growing, though not at the pace of best-in-class players like HDFC Bank or Kotak Mahindra Bank.
Catalyst-watching investors note that any further RBI relaxation of residual restrictions on Yes Bank (if any remain), positive quarterly results, or a strategic partnership announcement could serve as the next leg up for the stock. Conversely, any disappointment on NPA trajectory or capital adequacy could trigger a pullback.
📊 Financial Analysis
Yes Bank's technical setup is constructive for short-to-medium term traders, but the fundamental risk-reward for long-term investors is more nuanced. At current prices, the stock is priced at a premium to book value (approximately 1x to 1.3x depending on the quarter), which is reasonable for a bank in recovery but below the 2x-4x multiples commanded by well-established private sector banks.
The 15% rally in four sessions is rapid — such moves often result in short-term consolidation before the next directional leg. Traders should watch for: (1) volume on pullback days (low volume pullbacks are healthy; high volume pullbacks are warning signs); (2) whether the Rs 20-21 range, previously resistance, holds as support on any correction; and (3) broader banking sector sentiment, as Yes Bank's movement is often amplified by sector-wide tailwinds or headwinds.
For positional traders, the risk-reward at current levels favours a wait-for-pullback entry near Rs 19-20 support, with a stop-loss below the 50-day SMA and a target of Rs 24-26 over the next 4-8 weeks. Breakout traders who entered near Rs 20 have an opportunity to trail stops upward.
💹 Investor Insights
Long-term investors in Yes Bank need to assess whether the turnaround is durable enough to justify a holding in a competitive private banking landscape. The bank faces structural challenges — rebuilding CASA momentum, re-establishing corporate client relationships, and competing with well-capitalised peers for talent and market share. The risk-reward for patient investors exists but requires a 2-3 year investment horizon for the fundamental thesis to fully play out.
For traders, Yes Bank remains one of the highest-liquidity mid-cap banking stocks on NSE and BSE — making it a favourite for intraday and short-term positional strategies. The stock's high beta (sensitivity to market moves) means it amplifies both bullish and bearish market moves.
Frequently Asked Questions (FAQs)
- Is Yes Bank safe to invest in now?
- Yes Bank has stabilised significantly since the 2020 reconstruction and is now under normal regulatory supervision. However, it remains a higher-risk investment compared to established private sector banks. Its asset quality metrics are improving but lag peers. Investors should assess their risk tolerance carefully.
- What caused Yes Bank's near-collapse in 2020?
- Yes Bank accumulated large exposures to stressed corporate accounts (IL&FS, DHFL, etc.) which turned into NPAs. Combined with governance concerns around founder Rana Kapoor's management, the bank faced a severe liquidity crisis, prompting the RBI to impose a moratorium and orchestrate a reconstruction scheme led by SBI.
- What is RSI and what does it indicate for Yes Bank?
- RSI (Relative Strength Index) is a momentum oscillator ranging from 0 to 100. Readings above 70 are considered overbought (potential selling pressure ahead), while readings below 30 are oversold (potential buying opportunity). At an estimated 65-70, Yes Bank's RSI suggests the rally has momentum but is approaching levels where short-term traders may book profits.
- What are the key technical levels to watch for Yes Bank?
- Near-term support: Rs 19-20 (prior breakout level and approximate 50-day SMA). Near-term resistance: Rs 22-24. Medium-term target if fundamentals support: Rs 26-30. Stop-loss for positional traders: Rs 17-18 (below 200-day SMA).