
Highlights
- Wipro shares traded higher during May 15, 2026 morning trading session.
- Stock witnessed traded volumes exceeding 64 lakh shares on NSE.
- Shares remained near 52-week low despite intraday buying activity.
Shares of Wipro Limited (NSE:WIPRO) traded higher on May 15, 2026, with the stock gaining 1.06% to ₹190.44 during morning trade on the National Stock Exchange. The stock opened at ₹189.90 and touched an intraday high of ₹190.30, while the day’s low stood at ₹188.80.
Wipro shares traded above the previous closing level of ₹188.30 during the session. Trading activity remained elevated, with traded volumes reaching 64.67 lakh shares and traded value standing at ₹123.43 crore. The stock recorded a VWAP of ₹190.89 during the trading session.
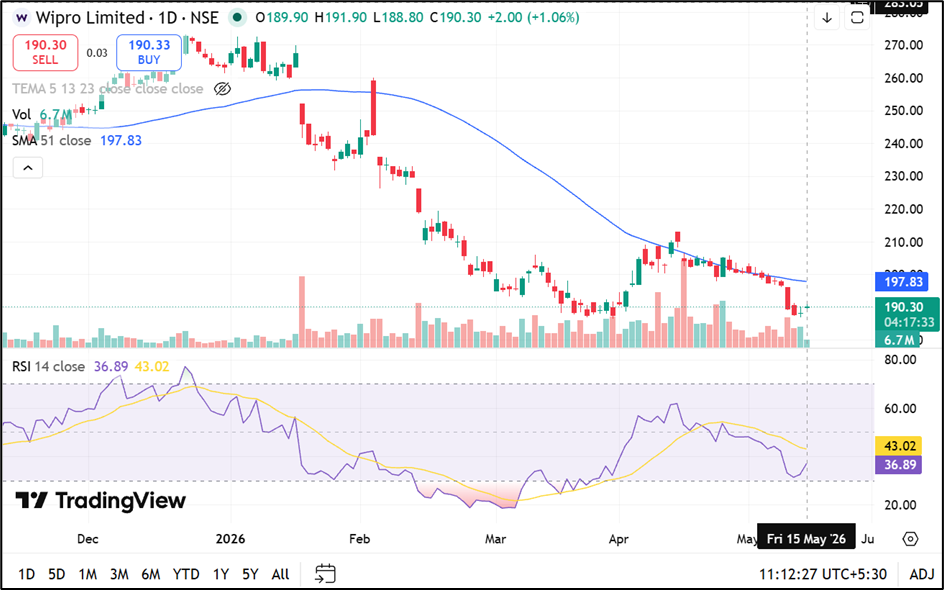
Stock Trades Near 52-Week Low Levels
Wipro shares continued trading close to their 52-week low of ₹186.50 recorded on March 30, 2026. The stock remains significantly below its 52-week high of ₹273.10 touched in December 2025.
The company’s market capitalisation stood at ₹1,99,885.78 crore, while free float market capitalisation was reported at ₹54,345.78 crore.
Wipro has delivered negative returns across several periods. The stock declined 3.59% over one week and 9.03% over one month. On a year-to-date basis, shares have fallen 28.63%, compared to the NIFTY 50 decline of 9.13% during the same period.
Long-Term Returns Stay Under Pressure
Over a one-year period, Wipro shares declined 25.63%. The stock also recorded a negative return of 1.08% over three years and declined 23.44% over five years, according to exchange data.
Despite weak long-term returns, the stock saw delivery-based participation during the session, with deliverable quantity accounting for 55.17% of traded quantity.
The stock’s annualised volatility stood at 31.14%, while daily volatility was reported at 1.63%.
IT Services Business Remains Core Focus
Wipro Limited operates as a global information technology, consulting and business process services company. The company remains among the major Indian IT services providers operating across global markets.
The company is considered the fourth-largest Indian player in the global IT services industry after Tata Consultancy Services, Infosys Limited and HCL Technologies Limited.
Source: Company Filing
Key Risks
- Weak global IT spending may impact client technology budgets and project demand.
- Currency fluctuations can affect earnings from overseas business operations.
- Margin pressure may rise due to higher employee and operational costs.
- Competitive pricing environment could impact revenue growth and profitability.
Summary
Wipro (NSE:WIPRO) shares rose 1.14% on May 15, 2026, during active trading on the NSE with volumes crossing 64 lakh shares. The stock traded near its 52-week low despite intraday gains and remains under pressure across one-year and five-year return periods.
Wipro continues operating as one of India’s largest IT services companies with global consulting and business process services operations.
FAQs
Q: What was Wipro share price on May 15, 2026?
A: Wipro shares traded at ₹190.44 during the morning trading session on NSE.
Q: What is Wipro’s 52-week low level?
A: Wipro recorded its 52-week low of ₹186.50 on March 30, 2026.
Q: How much did Wipro stock decline in 2026 so far?
A: Wipro shares declined 28.63% on a year-to-date basis as of May 15, 2026.