

Highlights
- Crizac shares climbed over 6 percent during the May 26 trading session.
- The stock touched its upper price band amid elevated investor participation levels.
- Trading volumes and market capitalization remained closely tracked by market participants.
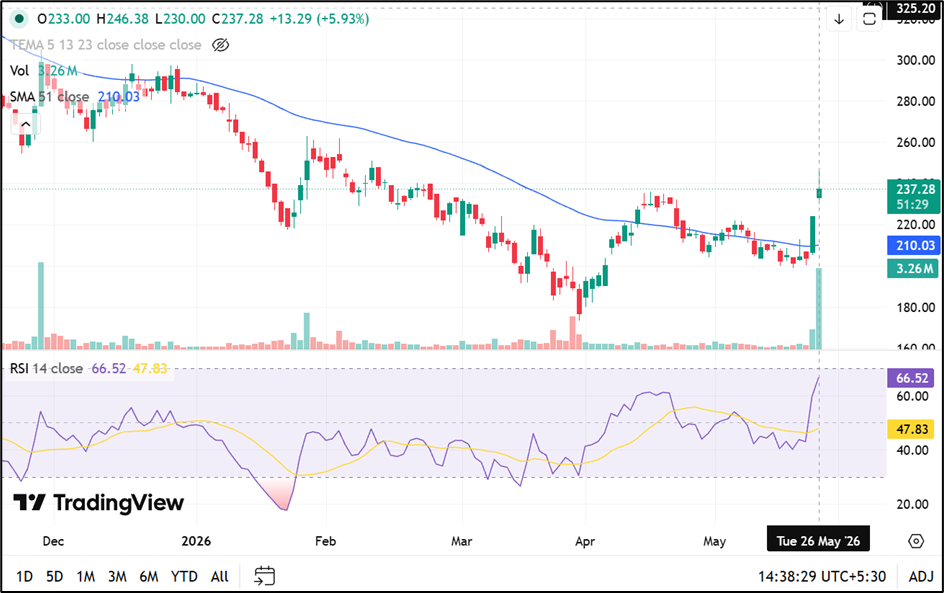
Crizac Limited (NSE:CRIZAC) shares traded higher on May 26, 2026, with the stock rising 5.93 percent to INR 237.28 during the afternoon session. The stock opened at INR 233.00 and touched an intraday high of INR 246.38, which also marked the upper circuit band for the day.
The company recorded significant trading activity, with traded volume reaching 32.44 lakh shares and traded value standing at INR 78.93 crore. Crizac’s volume-weighted average price during the session was INR 243.30.
Source: TradingView
Market Performance and Stock Trend
Crizac has delivered mixed returns across different time periods. The stock gained 16.13 percent over the past week and rose 11.59 percent during the last month. However, year-to-date performance remained negative at 16.12 percent decline.
The company’s total market capitalization stood at INR 4,167.56 crore, while free float market capitalization was recorded at INR 836.48 crore. The stock’s impact cost was 0.16, reflecting active market participation during the session.
Crizac traded within a 10 percent price band, with the lower circuit set at INR 201.60. The stock remained below its 52-week high of INR 387.95 recorded on September 8, 2025, while staying above its 52-week low of INR 173.35 touched on March 30, 2026.
Volatility and Delivery Metrics
Daily volatility for the stock stood at 2.44, while annualised volatility was reported at 46.62. Deliverable quantity as a percentage of traded quantity came in at 33.58 percent, indicating a mix of delivery-based and intraday participation.
Crizac’s applicable margin rate was 19.47 percent, while the company’s face value remained INR 2 per share.
About Crizac Limited
Incorporated in 2011, Crizac Limited operates as an education platform providing international student recruitment solutions to higher education institutions across multiple countries. The company works within the international education and student mobility segment.

Source: Company Filing
Key Risks Investors May Track
- High annualised volatility may result in sharp short-term price fluctuations.
- Stock remains below its 52-week high despite recent recovery momentum.
- Lower deliverable percentage may indicate elevated speculative trading activity.
- Education sector demand trends can impact student recruitment-related business activity.
Summary
Crizac Limited (NSE:CRIZAC) shares moved higher during the May 26 trading session, gaining more than 6 percent amid active trading volumes. The stock touched its upper price band and recorded weekly and monthly gains despite negative year-to-date returns. Investors continued monitoring volatility, trading activity, market capitalization levels, and the company’s position within the international student recruitment solutions segment.
FAQs
Q: Why did Crizac shares rise on May 26, 2026?
A: Crizac shares gained over 6 percent amid elevated trading volumes and increased market participation during intraday trade.
Q: What was Crizac’s intraday high during the session?
A: The stock touched an intraday high of INR 246.38, matching its upper circuit band level.
Q: What business does Crizac Limited operate in?
A: Crizac provides international student recruitment solutions for higher education institutions across various countries.