
Highlights
- Netweb Technologies stock gains 5.88 percent, nearing its recent 52-week high levels.
- One-year returns exceed 159 percent, significantly outperforming NIFTY 500 benchmark performance.
- FY26 net profit reported at ₹7,059 lakh with earnings per share of ₹12.43.
Shares of Netweb Technologies India Limited (NSE:NETWEB) traded at ₹4,151.80 on May 5, 2026, rising 5.71 percent from the previous close of ₹3,927.70. The stock opened at ₹3,946.00 and moved within a range of ₹3,927.80 to ₹4,168.00 during the session.
The current price remains close to its 52-week high of ₹4,479.00, recorded in October 2025. Trading activity remained active with volumes of 21.73 lakh shares and total traded value of ₹888.81 crore. The VWAP stood at ₹4,090.27, reflecting steady participation across intraday levels.
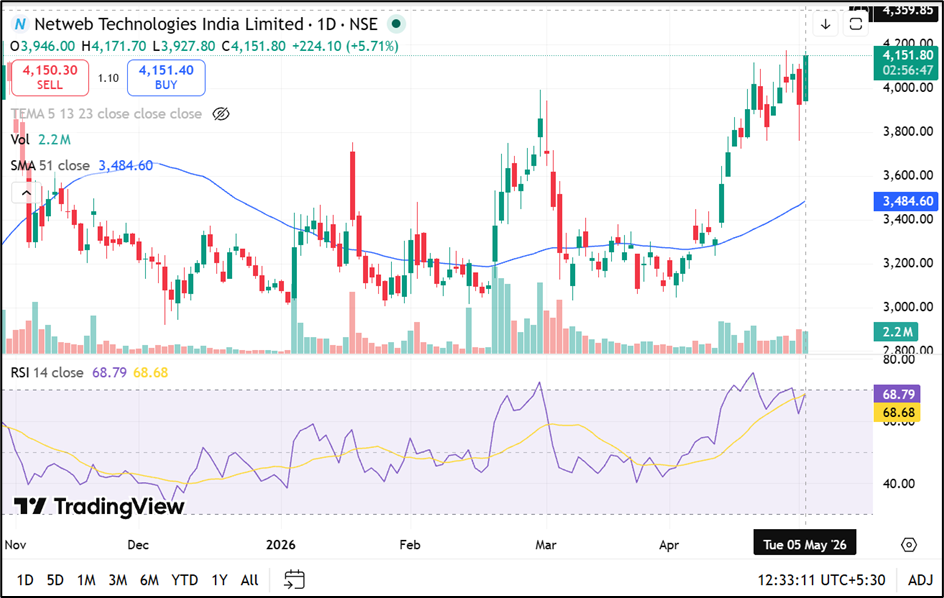
Source: TradingView
Returns Performance: Strong Momentum Over One Year
Netweb Technologies has delivered notable returns across timeframes. The stock gained 4.16 percent over one week and 32.13 percent in the past month.
Year-to-date returns stand at 35.52 percent, while the one-year return is significantly higher at 159.82 percent. This performance is substantially ahead of the NIFTY 500 index, which showed comparatively modest gains over the same periods.
Financial Performance: FY26 Earnings Snapshot
For the quarter ended March 31, 2026, the company reported standalone total income of ₹78,393.70 lakh. Profit before tax stood at ₹9,482.20 lakh, while net profit came in at ₹7,059.30 lakh.
Earnings per share for the quarter was ₹12.43. These figures reflect reported financials without adjustments or forward-looking assumptions.
Valuation and Market Metrics
The stock is currently trading with a price-to-earnings ratio above 50 based on the last four trailing quarters, indicating elevated valuation levels. It has also recorded a price movement exceeding 100 percent over the past 365 days.
Netweb Technologies (NSE:NETWEB) has a total market capitalisation of ₹23,678.78 crore, with a free float market cap of ₹6,874.14 crore. The impact cost remains low at 0.04, suggesting relatively efficient trade execution. Deliverable quantity stood at 28.48 percent of total traded volume.
Volatility and Trading Indicators
The stock exhibits a daily volatility of 3.35 percent and annualised volatility of 64.00 percent, indicating sharp price movements. The applicable margin rate is 25.80 percent, reflecting risk considerations in trading.
The stock operates within a 20 percent price band, with an upper band of ₹4,713.20 and a lower band of ₹3,142.20. The tick size is ₹0.10.
Key Risks
- Elevated PE above 50 suggests high valuation relative to earnings levels.
- High annualised volatility indicates significant price fluctuations in short timeframes.
- Sharp one-year rally may increase risk of price corrections.
- Lower delivery percentage reflects higher trading-led activity than long-term accumulation.
Summary
Netweb Technologies (NSE:NETWEB) shares rose nearly 6 percent, trading close to their 52-week high levels. The stock has delivered strong returns over the past year, significantly outperforming benchmark indices.
FY26 financials show reported profitability and earnings growth, while valuation remains elevated with a high PE ratio. Volatility and rapid price movements highlight key risks for market participants.
FAQs
- Why did Netweb Technologies stock rise recently?
The stock gained due to sustained momentum, active trading volumes, and strong recent returns across multiple timeframes. - What are Netweb Technologies’ latest financial results?
The company reported FY26 net profit of ₹7,059 lakh and total income of ₹78,393.70 lakh. - Is Netweb Technologies stock volatile?
Yes, the stock shows high volatility with 64 percent annualised volatility and notable short-term price fluctuations.