
Highlights
- TCS shares gained nearly 6% during the June 2 trading session.
- The stock rebounded sharply from its recent 52-week low levels.
- Trading volumes crossed INR 1,580 crore amid increased investor activity.
Tata Consultancy Services Limited (NSE:TCS), the flagship technology services company of the Tata Group, witnessed strong buying interest during trading on June 2, 2026. The stock rose nearly 6% in intraday trade, making it one of the notable gainers among large-cap information technology stocks.
TCS shares were trading at INR 2,434.10, up 5.58% from the previous close of INR 2,297.40. The stock opened at INR 2,320.00 and touched an intraday high of INR 2,451.10, while the day's low stood at INR 2,316.20.
Recovery Follows Recent 52-Week Low
The latest rally comes after TCS recently touched its 52-week low of INR 2,206.40 on May 14, 2026. Despite the sharp rebound seen in recent sessions, the stock remains significantly below its 52-week high of INR 3,538.00 recorded on June 18, 2025.
The gap between the current market price and the 52-week high highlights the correction witnessed in the stock over the past year. However, the recent recovery suggests renewed investor interest following a period of weakness in the information technology sector.
Heavy Trading Activity Supports Gains
Market participation remained strong throughout the session. Around 65.90 lakh shares were traded, generating a traded value of approximately INR 1,582.76 crore.
The stock recorded a volume-weighted average price (VWAP) of INR 2,401.68, indicating that buying activity remained active during the trading day. TCS also maintained a low impact cost of 0.02, reflecting high liquidity and efficient price discovery.
With a total market capitalization of approximately INR 8.81 lakh crore, TCS continues to rank among India's largest listed companies.
Long-Term Returns Remain Under Pressure
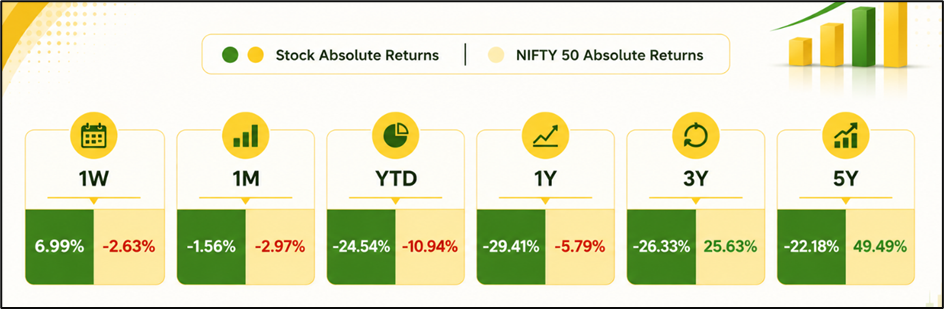
While the stock posted a strong one-day gain, longer-term performance metrics continue to reflect challenges. Over the past week, TCS delivered a return of 6.99%, outperforming the NIFTY 50 index, which declined 2.63% during the same period. However, the stock has generated negative returns across several longer timeframes. TCS declined 1.56% over the past month, 24.54% on a year-to-date basis, and 29.41% over the last one year.
These figures compare with declines of 2.97%, 10.94%, and 5.79%, respectively, for the NIFTY 50. The three-year and five-year return data also indicate underperformance relative to the benchmark index.
Source: NSE
Tata Consultancy Services Business Overview
Tata Consultancy Services is the flagship company of the Tata Group and operates as a global information technology services, consulting, and business solutions provider.
The company offers a consulting-led portfolio of business, technology, engineering, and digital transformation services. TCS serves clients across multiple industries and has maintained a presence in global technology services for more than five decades.
Its operations span application development, cloud services, artificial intelligence, cybersecurity, digital engineering, enterprise solutions, and business process services.
Market Metrics and Volatility Indicators
TCS currently has a free-float market capitalization of approximately INR 2.48 lakh crore. The stock's annualized volatility stands at 27.89%, while daily volatility is reported at 1.46%.
The applicable margin rate is 13%, and more than 55% of traded shares were marked for delivery, indicating participation from both traders and investors. These metrics provide insight into the stock's liquidity profile and recent trading behaviour.
Share Price Performance
TCS shares rose 5.58% during the June 2 session to INR 2,425.70 after touching an intraday high of INR 2,451.10. The stock has recovered from its recent 52-week low of INR 2,206.40 but remains below the 52-week high of INR 3,538.00. While short-term performance has improved, year-to-date returns remain negative at 24.54%.
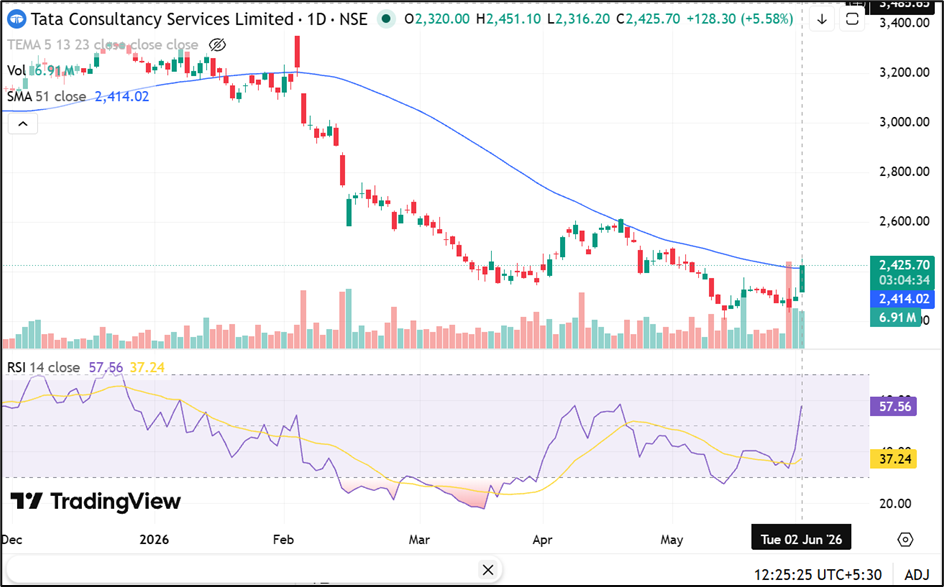
Source: TradingView
Key Risks to Monitor
- Global IT spending trends may affect revenue visibility.
- Currency fluctuations can influence profitability and margins.
- Economic slowdowns may delay client technology investments.
- Competitive pricing pressure could impact future growth.
Summary
Tata Consultancy Services (NSE:TCS) shares gained nearly 6% during the June 2 trading session, supported by strong trading activity and renewed investor interest. The stock rebounded from recent 52-week low levels, although it remains well below last year's peak.
Despite short-term strength, TCS continues to show negative returns across several longer-term periods, reflecting broader challenges faced by the information technology sector.
FAQs
Q: Why is TCS share price rising today?
A: TCS shares gained nearly 6% amid strong buying activity and increased trading volumes.
Q: What is TCS's 52-week high and low?
A: The stock's 52-week high is INR 3,538.00 and its low is INR 2,206.40.
Q: How has TCS performed in 2026 so far?
A: The stock has declined 24.54% on a year-to-date basis despite recent gains.