
Highlights
- Black Box stock rises 5.17 percent, touching a fresh 52-week high.
- One-month returns surge over 47 percent, outperforming broader market indices.
- Stock trades at PE above 50 with strong multi-year return performance.
Shares of Black Box Limited (NSE:BBOX) traded at ₹695.50 on May 5, 2026, gaining 4.91 percent from the previous close of ₹661.30. The stock opened at ₹658.55 and moved within a range of ₹651.55 to ₹702.90 during the session.
The intraday high of ₹702.90 marks its 52-week high, indicating continued buying activity. Trading volumes stood at 11.86 lakh shares, with a traded value of ₹81.64 crore. The VWAP was recorded at ₹688.28, reflecting steady participation across price levels.
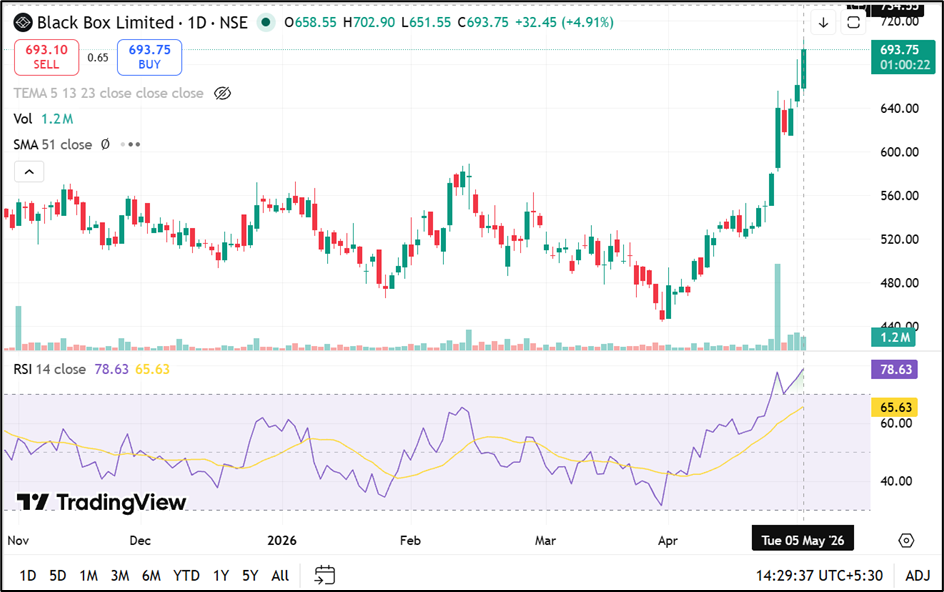
Source: TradingView
Returns Performance: Strong Across Timeframes
Black Box (NSE:BBOX) has delivered strong returns across multiple periods. The stock gained 8.85 percent over one week and 47.58 percent over the past month, significantly outperforming the broader market.
Year-to-date returns stand at 27.32 percent, while one-year returns are at 71.30 percent. Over longer durations, the stock has delivered 407.84 percent returns over three years and 123.22 percent over five years.
Financial Performance: December 2025 Snapshot
For the quarter ended December 31, 2025, the company reported consolidated total income of ₹1,66,076 lakh. Profit before tax stood at ₹5,675 lakh, while net profit came in at ₹4,968 lakh, with earnings per share at ₹2.92.
On a standalone basis, total income was ₹10,413 lakh, while the company reported a net loss of ₹134 lakh with EPS of -₹0.08. These figures reflect reported financials without adjustments.
Valuation and Market Indicators
The stock is currently trading with a price-to-earnings ratio above 50 based on the last four trailing quarters. It has also recorded a price movement exceeding 25 percent over the past one month.
Black Box has a total market capitalisation of ₹12,359.88 crore, with a free float market cap of ₹3,373.62 crore. The impact cost is 0.08, indicating moderate liquidity. Deliverable quantity stood at 34.67 percent of traded volume.
Volatility and Trading Conditions
The stock recorded daily volatility of 2.98 percent and annualised volatility of 56.93 percent, indicating elevated price fluctuations. The applicable margin rate is 23.20 percent.
The stock trades within a 20 percent price band, with an upper band of ₹793.55 and a lower band of ₹529.05. The tick size is ₹0.05.
Key Risks
- High PE above 50 indicates elevated valuation relative to earnings.
- High volatility may lead to sharp short-term price movements.
- Standalone financials show reported losses in recent quarter.
- Strong recent rally increases probability of price corrections.
Summary
Black Box (NSE:BBOX) shares rose over 5 percent, reaching a fresh 52-week high during the session. The stock has delivered strong gains across short- and long-term periods, outperforming broader market indices. December 2025 financials show profitability on a consolidated basis, while standalone losses and high valuation indicate potential risks for market participants.
FAQs
Q: Why did Black Box stock rise today?
A: The stock gained due to strong momentum, recent rally, and increased trading activity compared to broader market performance.
Q: What are Black Box’s latest financial results?
A: The company reported December 2025 consolidated net profit of ₹4,968 lakh, while standalone operations reported a loss.
Q: Is Black Box stock volatile?
A: Yes, the stock shows high volatility with 56.93 percent annualised volatility and noticeable short-term price fluctuations.