
Highlights
- Tech Mahindra shares advanced more than 2% during Monday's session.
- The stock touched an intraday high of Rs 1,441.00 amid active trading.
- Consolidated net profit stood at Rs 1,356.40 crore in Q4 FY26.
Tech Mahindra Limited (NSE:TECHM) shares moved higher on June 22, 2026, with the stock rising 2.38% to Rs 1,443. The gain of Rs 30.30 came against the previous close of Rs 1,409.60. The stock opened at Rs 1,414.00 and climbed to an intraday high of Rs 1,441.00.
The day's low matched the opening price at Rs 1,414.00, indicating a positive trend during the session. Trading activity remained steady, with 5.03 lakh shares changing hands. The traded value stood at Rs 71.93 crore, while the volume-weighted average price (VWAP) was Rs 1,431.11.
Q4 FY26 Financial Performance
For the quarter ended March 31, 2026, Tech Mahindra reported consolidated total income of Rs 14,871.40 crore. Profit before tax stood at Rs 1,790.60 crore, while net profit came in at Rs 1,356.40 crore. Earnings per share for the quarter were Rs 15.27.
On a standalone basis, total income was Rs 12,761.30 crore. Profit before tax stood at Rs 828.30 crore, while net profit was reported at Rs 541.30 crore. Standalone earnings per share came in at Rs 5.52. The company announced its quarterly financial results on April 22, 2026.
Market Capitalisation And Valuation
Tech Mahindra has a market capitalisation of Rs 1.41 lakh crore, while its free-float market capitalisation stands at Rs 91,134.41 crore.
The stock is currently trading at a price-to-earnings ratio of 28.75, with an adjusted P/E ratio of 27.68. It is part of the Nifty 50 index and operates within the Computers - Software & Consulting industry. Tech Mahindra has been listed on Indian stock exchanges since August 28, 2006.
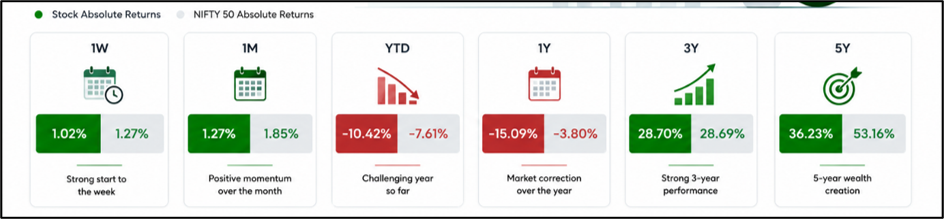
Return Performance Across Timeframes
The stock has delivered mixed returns over different periods. During the last week, Tech Mahindra gained 1.02%, compared with a 1.27% rise in the Nifty 50.
Over one month, the stock advanced 1.27%, while the benchmark gained 1.85%. On a year-to-date basis, Tech Mahindra declined 10.42%, compared with a 7.61% fall in the Nifty 50. The stock has generated returns of 28.70% over three years and 36.23% over five years. However, its one-year return stands at negative 15.09%.
 Source: NSE
Trading Range And Volatility Indicators
Tech Mahindra's 52-week high is Rs 1,854.00, recorded on February 3, 2026, while its 52-week low is Rs 1,304.10, touched on March 9, 2026.
The stock currently trades without any price band restrictions. Daily volatility stands at 1.77%, while annualised volatility is reported at 33.82%. The impact cost is 0.03, reflecting relatively liquid trading conditions.
Business Overview
Tech Mahindra Ltd provides a comprehensive range of information technology services, including IT-enabled services, application development and maintenance, consulting, digital transformation services and enterprise business solutions. The company serves a diversified base of corporate customers across multiple industries and geographies.
Key Risks To Watch
- Slowdown in global technology spending may affect revenue growth.
- Client budget reductions can impact project demand.
- Currency fluctuations may influence overseas earnings.
- Intense competition could affect pricing and margins.
Today's Share Performance
Tech Mahindra shares traded in positive territory on June 22, 2026, gaining 2.38% to Rs 1,443.20 during morning trade. The stock touched an intraday high of Rs 1,441.00 after opening at Rs 1,414.00. Trading volume reached 5.03 lakh shares, with turnover of Rs 71.93 crore.
At the current market price, the stock is approximately 22.3% below its 52-week high of Rs 1,854.00 and around 10.4% above its 52-week low of Rs 1,304.10.
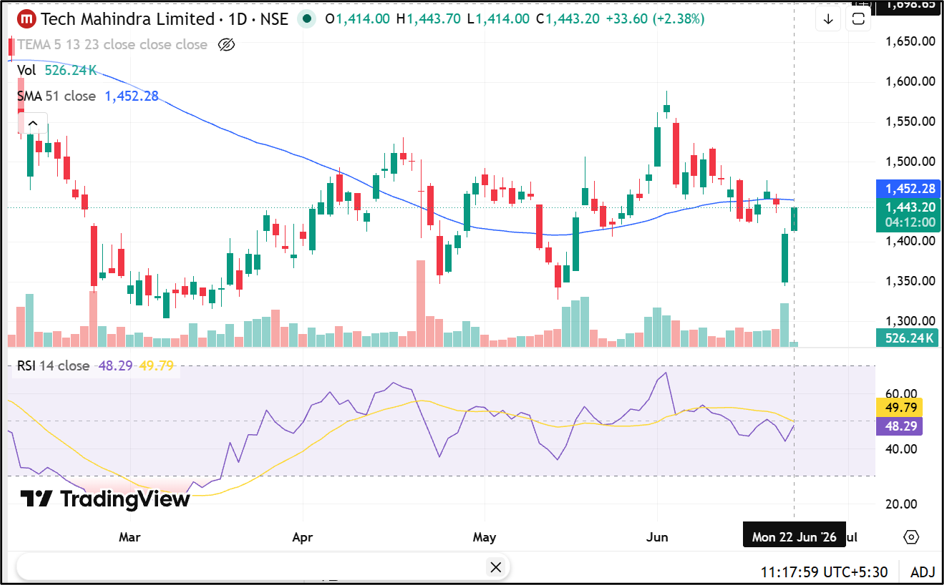
Source: TradingView
Summary
Tech Mahindra (NSE:TECHM) shares rose 2.38% on June 22, 2026, amid positive market activity. The company reported consolidated total income of Rs 14,871.40 crore and net profit of Rs 1,356.40 crore for the March 2026 quarter. While the stock remains below its 52-week high, it continues to be a constituent of the Nifty 50 and one of the notable players in the IT services sector.
FAQs
Q: Why did Tech Mahindra shares rise on June 22, 2026?
A: The stock gained 2.38% during the session amid positive trading activity and investor participation.
Q: What was Tech Mahindra's consolidated net profit in Q4 FY26?
A: The company reported consolidated net profit of Rs 1,356.40 crore for the March 2026 quarter.
Q: What is Tech Mahindra's current 52-week trading range?
A: The stock's 52-week high is Rs 1,854.00 and the 52-week low is Rs 1,304.10.