
Highlights
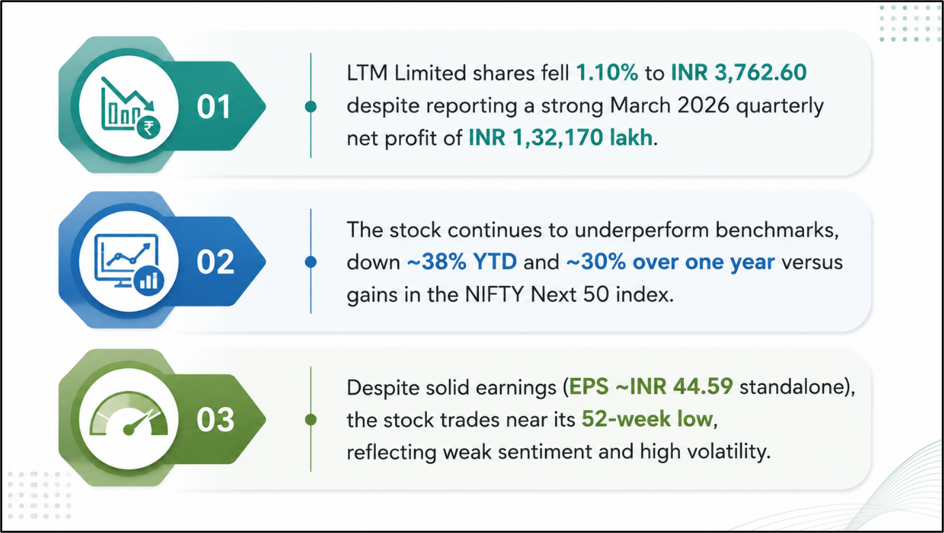
- LTM Limited shares declined 1.10% to close at INR 3,762.60 in latest session.
- Company reported standalone net profit of INR 1,32,170.00 lakh for March 2026 quarter.
- Stock remains significantly below its 52-week high of INR 6,429.50.
LTM Limited (NSE:LTM), listed on the National Stock Exchange (NSE) under the IT and consulting sector, closed at INR 3,762.60 on June 25, 2026, marking a decline of INR 41.10 or 1.08% from the previous close.
The stock opened the session at INR 3,824.00 and moved between an intraday high of INR 3,837.50 and a low of INR 3,750.00. The Volume Weighted Average Price (VWAP) for the session stood at INR 3,787.65, indicating trading activity slightly above the closing level.
Source: Analysis by Kalkine
Trading Activity and Market Capitalisation
LTM Limited recorded a traded volume of 2.42 lakh shares with a traded value of INR 91.48 crore during the session. The stock’s impact cost remained low at 0.03, suggesting relatively smooth trade execution.
The company’s total market capitalisation stood at INR 1,11,588.94 crore, while the free-float market capitalisation was INR 34,823.78 crore. Deliverable quantity accounted for 46.60% of total traded volume, reflecting moderate investor participation in delivery-based trades.
Stock Performance Across Time Frames
LTM Limited has shown negative performance across multiple time frames compared to benchmark indices. Over the past week, the stock declined 1.84%, while the NIFTY Next 50 index fell 0.22%. On a one-month basis, the stock dropped 5.25% even as the benchmark gained 1.77%. Year-to-date performance shows a decline of 38.45%, contrasting with a 3.62% gain in the NIFTY Next 50 index. Over one year, the stock is down 29.98%, while the index is up 5.72%.
The stock also reflects longer-term pressure, with a three-year decline of 24.87% and a five-year decline of 10.76%, compared with strong gains in the broader index. The 52-week high stands at INR 6,429.50 (recorded on January 19, 2026), while the 52-week low is INR 3,737.30 (recorded on June 23, 2026), placing current levels near the lower range of its yearly band.
Financial Performance Overview
For the quarter ended March 31, 2026, LTM Limited reported standalone total income of INR 10,95,930.00 lakh. Profit before tax stood at INR 1,78,360.00 lakh, while net profit was INR 1,32,170.00 lakh. Earnings per share (EPS) for the quarter came in at INR 44.59.
On a consolidated basis, total income stood at INR 11,46,640.00 lakh, with profit before tax of INR 1,88,100.00 lakh and net profit of INR 1,38,730.00 lakh. EPS for consolidated results was INR 46.97.
Valuation and Market Position
LTM Limited is part of the NIFTY Next 50 index and operates in the Computers – Software & Consulting industry. The stock’s P/E ratio stands at 22.40, while adjusted P/E is 20.81.
The stock has been listed since July 21, 2016 and continues to remain actively traded with moderate volatility levels. Annualised volatility is reported at 38.21, indicating price fluctuations higher than many large-cap peers.
Key Risks
- Weakness in IT spending cycles may affect revenue visibility.
- High volatility increases short-term price unpredictability.
- Underperformance versus benchmark indices may impact investor sentiment.
- Dependence on global outsourcing demand exposes earnings to macro risks.
Summary
LTM Limited shares ended June 25, 2026 lower by 1.10% at INR 3,762.60 amid weak recent performance trends. Despite reporting standalone net profit of INR 1,32,170.00 lakh for March 2026 quarter, the stock remains under pressure across all major timeframes and trades significantly below its 52-week high level of INR 6,429.50.
FAQs
Q: What was LTM Limited’s closing price on June 25, 2026?
A: The stock closed at INR 3,762.60 after declining 1.10% during the trading session.
Q: What is LTM Limited’s recent quarterly net profit?
A: The company reported standalone net profit of INR 1,32,170.00 lakh for March 2026 quarter.
Q: How has LTM Limited performed compared to NIFTY Next 50 index?
A: The stock underperformed significantly, falling 38.45% year-to-date versus index gains.