

Highlights
- HFCL shares climbed 8.73 percent during May 25 trading session.
- Stock touched fresh 52-week high of INR 162.50 on NSE.
- HFCL outperformed NIFTY 500 across short-term and long-term periods.
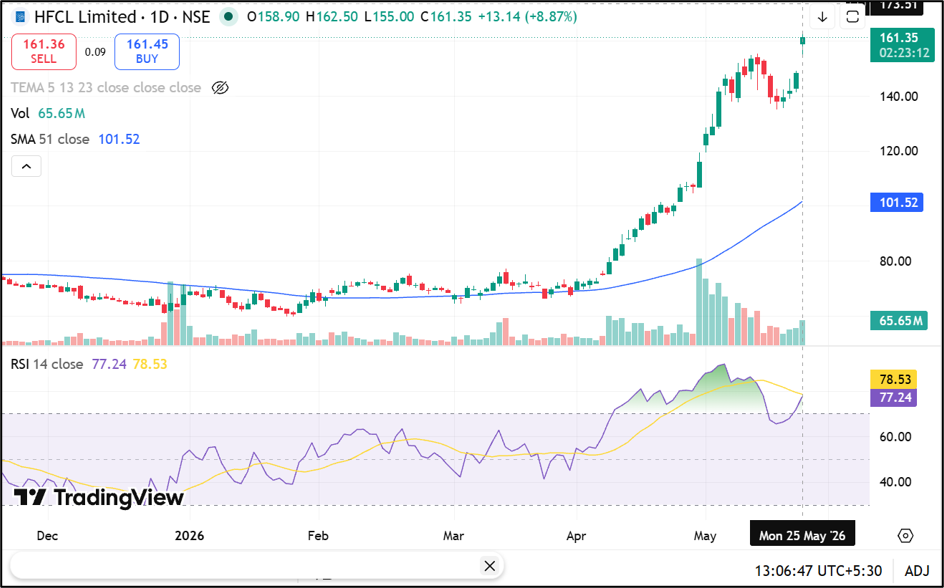
HFCL Limited (NSE:HFCL) shares gained 8.87 percent on May 25, 2026, reaching INR 161.35 during afternoon trading on the National Stock Exchange of India. The stock opened at INR 158.90 and touched an intraday high of INR 162.50, which also marked a new 52-week high.
The day’s low stood at INR 155.00. HFCL recorded traded volume of 655.47 lakh shares with traded value of INR 1,048.16 crore. The company’s total market capitalisation stood at INR 24,665.66 crore.
Source: Trading View
Telecom Infrastructure Business Remains Core Focus
HFCL operates in telecom infrastructure development, system integration, and telecom equipment manufacturing. The company manufactures optical fiber and optical fiber cable products while also participating in telecom network infrastructure projects.
HFCL’s business includes high-end telecom equipment supply and optical communication solutions across domestic and international markets.
Trading Metrics Indicate High Market Activity
The stock’s annualised volatility stood at 57.51, while daily volatility was reported at 3.01. Deliverable quantity as a percentage of traded quantity stood at 37.18 percent. The stock was trading in ASM-1 category during the session. The NSE data also showed that HFCL’s trailing four-quarter price-to-earnings ratio remained above 50.
Stock Outperforms Benchmark Indices
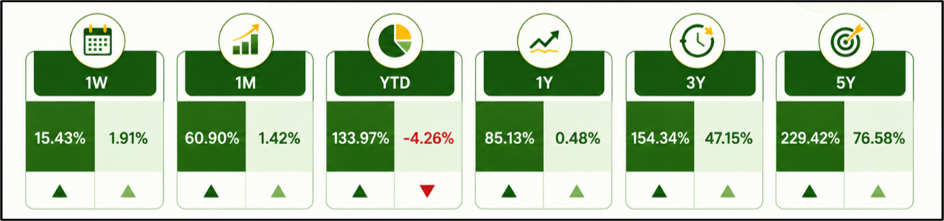
HFCL significantly outperformed the NIFTY 500 index across multiple periods. The stock delivered returns of 15.40 percent in one week compared with 1.89 percent for the NIFTY 500. Monthly returns stood at 60.85 percent against 1.39 percent for the benchmark index.
Year-to-date returns reached 133.89 percent, while one-year returns stood at 85.07 percent. Over a three-year period, the stock gained 154.26 percent, and five-year returns reached 229.32 percent.
Source: NSE
Key Risks
- High stock volatility may increase near-term price fluctuations for investors.
- Elevated valuation levels could trigger profit-booking activity in the market.
- Telecom infrastructure spending cycles may impact order inflows and revenue visibility.
- Regulatory or policy changes could affect telecom sector capital expenditure trends.
Summary
HFCL (NSE:HFCL) shares advanced 8.73 percent during May 25 trading and touched a fresh 52-week high of INR 162.50. The stock has substantially outperformed the NIFTY 500 across weekly, monthly, yearly, and long-term periods. HFCL continues to operate across telecom infrastructure, optical fiber manufacturing, and telecom equipment businesses amid elevated market activity and trading volumes.
FAQs
Q: What was HFCL’s share price movement on May 25, 2026?
A: HFCL shares gained 8.73 percent and touched a 52-week high of INR 162.50 during trading.
Q: How has HFCL performed against the NIFTY 500 index?
A: HFCL outperformed the benchmark across one-week, one-month, yearly, and long-term return periods.
Q: What businesses does HFCL operate in?
A: HFCL operates in telecom infrastructure, optical fiber manufacturing, system integration, and telecom equipment supply businesses.