
Highlights
- Coforge shares declined more than 2% during Tuesday’s NSE trading session.
- The stock continued outperforming the NIFTY IT index across several periods.
- Coforge market capitalisation remained above INR 45,000 crore during trade.
Coforge Limited (NSE:COFORGE) shares traded lower during the May 12 session on the National Stock Exchange. The stock was trading at INR 1,343.80, down 2.28% from the previous close of INR 1,375.20.
The stock opened at INR 1,373.40 and touched an intraday high of INR 1,373.40 before declining to a low of INR 1,323.00 during the session.
Coforge shares remain below their 52-week high of INR 1,994.00 recorded on July 8, 2025.
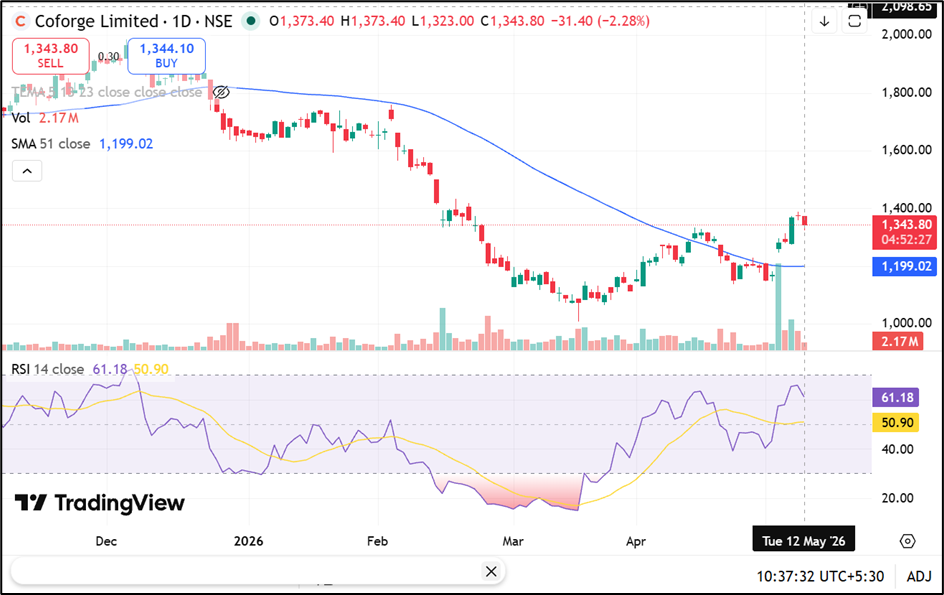
Source: TradingView
Trading Volumes and Market Capitalisation
The stock recorded traded volume of 21.31 lakh shares during the session, while traded value stood at INR 284.64 crore.
The company’s total market capitalisation was INR 45,074.51 crore, while free float market capitalisation stood at INR 45,020.15 crore. The stock’s VWAP during the session was INR 1,335.57.
Deliverable quantity as a percentage of traded quantity stood at 55.47%, while impact cost remained at 0.03.
Performance Compared With NIFTY IT
Coforge shares continued outperforming the NIFTY IT index across multiple periods despite recent declines.
The stock gained 14.83% over one week and 9.62% over one month, compared with declines of 2.91% and 8.93%, respectively, in the NIFTY IT index.
On a year-to-date basis, Coforge shares declined 18.95%, while the benchmark IT index fell 25.96%. Over one year, the stock declined 19.26%, compared with a 26.18% decline in the NIFTY IT index.
Coforge generated returns of 64.25% over three years and 97.83% over five years, outperforming the benchmark index over both periods.
Volatility and Business Overview
The stock recorded annualised volatility of 46.04%, while daily volatility stood at 2.41. Coforge touched its 52-week low of INR 1,008.10 on March 17, 2026.
The applicable margin rate stood at 19.07%, while the face value remained INR 2 per share.
According to the company profile, Coforge provides end-to-end software solutions and services and is among the top-20 Indian software exporters. The company serves clients across industries and operates through subsidiaries in multiple international markets.
Q4 FY26 Financials
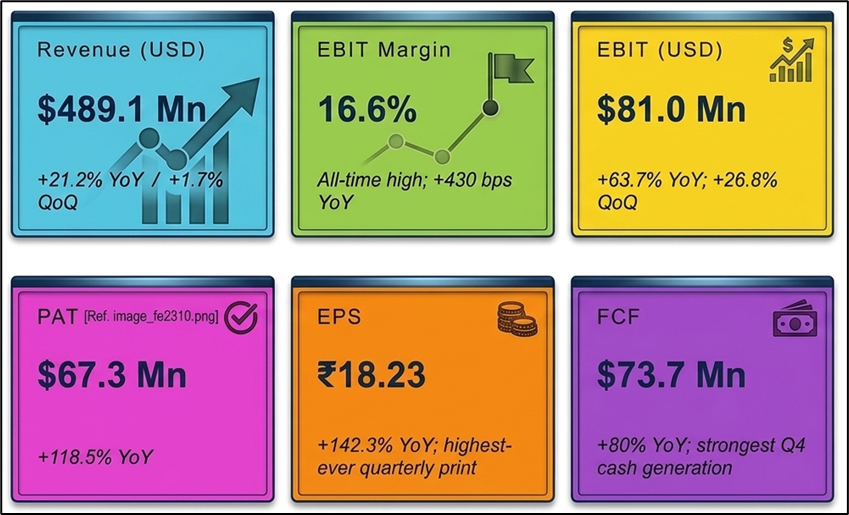
source: Company Filings
Key Risks Investors Monitor
- Global IT spending slowdown may impact client technology budgets.
- Currency fluctuations can affect overseas revenue performance.
- Competitive pricing pressure may influence operating margins.
- Economic uncertainty could delay enterprise technology projects.
Summary
Coforge (NSE:COFORGE) shares declined more than 2% during Tuesday’s NSE trading session despite outperforming the NIFTY IT index across several return periods. The stock remained below its 52-week high amid broader volatility in technology shares. Market participants continue tracking global IT spending trends, enterprise demand, and currency movements affecting export-oriented software companies.
FAQs
Q: What was Coforge share price on May 12, 2026?
A: Coforge shares traded at INR 1,342.10, down 2.41% during the NSE session.
Q: What is the 52-week high level of Coforge shares?
A: The stock’s 52-week high was INR 1,994.00, recorded on July 8, 2025.
Q: How has Coforge performed against the NIFTY IT index?
A: Coforge outperformed the NIFTY IT index across one-week, one-month, three-year, and five-year periods.