
Highlights
- Tech Mahindra shares declined over 3% during intraday trade on May 14, 2026.
- The stock has fallen more than 17% on a year-to-date basis.
- TECHM remained near its 52-week low amid pressure across IT sector counters.
Shares of Tech Mahindra Limited (NSE:TECHM) declined during trading on May 14, 2026, as weakness in information technology stocks continued to weigh on investor sentiment. The stock traded at INR 1,334.00, down 2.98% from the previous close of INR 1,375. TECHM opened at INR 1,370 and slipped to an intraday low of INR 1,331.80 during the session.
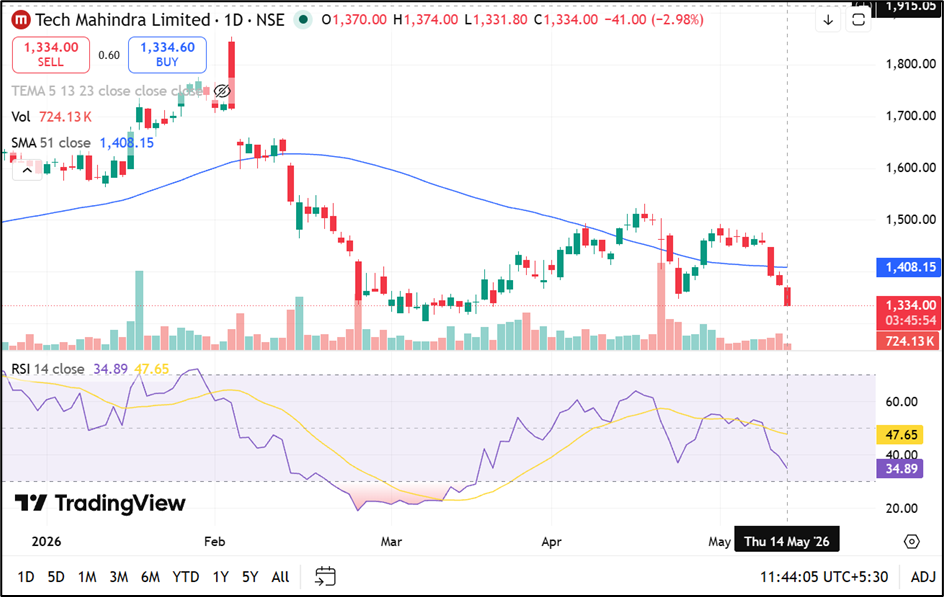
Source: Trading View
Stock Underperforms Benchmark Indices
Tech Mahindra has underperformed the benchmark NIFTY 50 across shorter-term periods. The stock declined 17.04% on a year-to-date basis and 16.80% over one year. In comparison, the NIFTY 50 recorded smaller declines during the same periods.
Over three years, TECHM delivered returns of 27.47%, while five-year returns stood at 40.08%. Investors continued monitoring global technology spending trends, outsourcing demand and earnings visibility across the IT services sector.
Trading Activity Remains Active
During the session, traded volume stood at 7.06 lakh shares, while traded value reached INR 95.19 crore. The stock’s VWAP was recorded at INR 1,348.05. Deliverable quantity accounted for 46.96% of traded volume.
Tech Mahindra’s market capitalisation stood at approximately INR 1.30 lakh crore, while free float market capitalisation was reported at INR 84,422 crore. The stock’s impact cost remained at 0.03, indicating active liquidity in the counter.
IT Services Business Spans Multiple Segments
Tech Mahindra provides information technology services across application development, enterprise business solutions, consulting and IT-enabled services. The company serves clients across multiple industries and operates in diversified enterprise technology segments.
Market participants continued tracking global macroeconomic trends, discretionary technology spending and demand visibility across outsourcing-focused businesses.
Source: Company Filing
Volatility and Price Metrics in Focus
The stock’s annualised volatility stood at 32.48%, while daily volatility was recorded at 1.70%. The applicable margin rate for the stock stood at 14.26%. The upper price band for the session was fixed at INR 1,512.50, while the lower band stood at INR 1,237.50.
Key Risks
- Slower global technology spending may affect enterprise client demand trends.
- Currency fluctuations could influence earnings and operating margin performance.
- Competitive pricing pressure may impact profitability across IT service contracts.
- Weak sector sentiment may continue affecting near-term stock performance.
Summary
Tech Mahindra (NSE:TECHM) shares declined over 3% during intraday trading and remained near their 52-week low amid weakness across IT sector stocks. The stock has fallen more than 17% on a year-to-date basis as investors tracked global technology spending trends, outsourcing demand and broader market sentiment affecting Indian IT companies.
FAQs
Q: Why did TECHM shares decline on May 14, 2026?
A: The stock fell amid continued weakness and selling pressure across information technology sector counters.
Q: What is Tech Mahindra’s 52-week low level?
A: TECHM touched its 52-week low of INR 1,304.10 on March 9, 2026.
Q: What businesses does Tech Mahindra operate in?
A: The company provides IT services, consulting, enterprise solutions and application development services globally.