
Highlights
- Oracle Financial Services Software shares are trading close to their 52-week high.
- The stock has significantly outperformed the Nifty IT index across timeframes.
- Standalone net profit stood at INR 1,11,110 lakh in Q4 FY26.
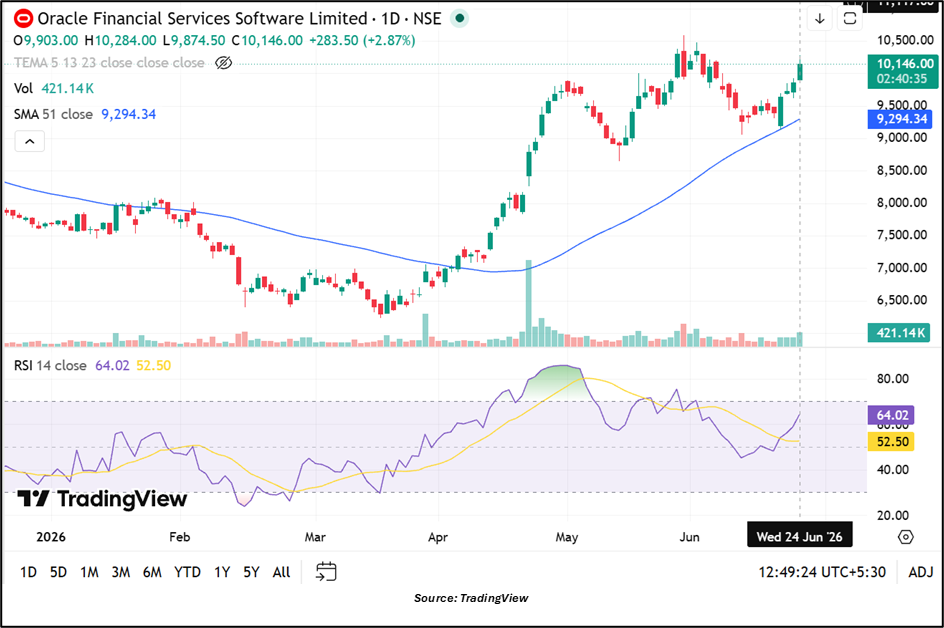
Oracle Financial Services Software Limited (NSE:OFSS), a provider of financial software, consulting, application development, IT infrastructure management and business process outsourcing services for the financial services industry, remained in focus on June 24, 2026. The stock was trading at INR 10,146.00, up 2.87% from its previous close of INR 9,862.50.
The stock touched an intraday high of INR 10,284.00 and remained close to its 52-week high of INR 10,584.50 recorded on May 29, 2026. Based on the current trading price, the stock is approximately 4.1% below its annual peak. The 52-week low stands at INR 6,234.50, recorded on March 17, 2026.
Oracle Financial Services Software is a subsidiary of Oracle Global (Mauritius) Limited and operates within the software products industry. The stock is also part of the Nifty LargeMidcap 250 index.
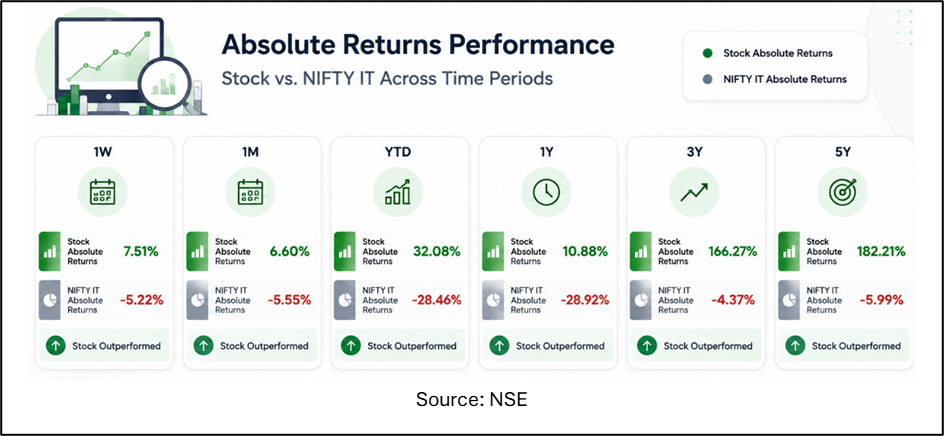
Outperformance Against Nifty IT
The company's share price performance has exceeded that of the Nifty IT index across multiple periods. Over the past week, the stock gained 7.51%, while the Nifty IT index declined 5.22%. During the last month, Oracle Financial Services Software advanced 6.60%, compared with a 5.55% decline in the sectoral benchmark.
On a year-to-date basis, the stock has gained 32.08%, significantly outperforming the Nifty IT index, which fell 28.46%. The one-year return stands at 10.88%, while the benchmark index declined 28.92%.
Longer-term returns also show a notable divergence. Oracle Financial Services Software has delivered gains of 166.27% over three years and 182.21% over five years, while the Nifty IT index recorded negative returns over both periods.
Trading Activity And Market Metrics
Trading activity remained active during the session, with 4.19 lakh shares changing hands. The total traded value stood at INR 425.40 crore. The stock opened at INR 9,903.00 and moved between an intraday low of INR 9,874.50 and a high of INR 10,284.00.
The volume-weighted average price (VWAP) was INR 10,159.31. Deliverable quantity accounted for 39.45% of traded volume. The company currently has a market capitalisation of INR 88,400.77 crore, while free-float market capitalisation stands at INR 24,121.87 crore.
Q4 FY26 Financial Performance
For the quarter ended March 31, 2026, Oracle Financial Services Software reported standalone total income of INR 2,05,640 lakh. Profit before tax stood at INR 1,39,980 lakh, while net profit came in at INR 1,11,110 lakh. Earnings per share (EPS) for the quarter was reported at INR 127.68.
On a consolidated basis, total income stood at INR 2,13,650 lakh. Consolidated profit before tax was INR 1,12,010 lakh, while consolidated net profit reached INR 84,170 lakh. Consolidated EPS for the quarter stood at INR 96.72.
The financial results were announced on April 22, 2026.
Valuation And Volatility Indicators
Oracle Financial Services Software is currently trading at a price-to-earnings (P/E) ratio of 32.53. Daily volatility stands at 2.12%, while annualised volatility is 40.50%.
The applicable margin rate is 17.09%, and the stock trades with a tick size of INR 0.50. Exchange data also indicates that the stock recorded a close-to-close price movement of more than 50% during the previous three months.
Bull Case
Oracle Financial Services Software has outperformed the Nifty IT index across all major timeframes presented. The company reported profitability in the latest quarter and the stock continues to trade near its 52-week high. Its presence in financial technology and software products provides exposure to the banking and financial services sector.
Bear Case
The stock is trading at a relatively higher valuation multiple compared with some broader market segments. Annualised volatility remains elevated at above 40%, while business performance remains linked to technology spending trends in the financial services industry.
Key Risks
- Changes in technology spending by financial institutions.
- Intensifying competition in financial software markets.
- Currency fluctuations affecting overseas revenue.
- Regulatory changes impacting banking technology requirements.
Today's Share Price Performance
Oracle Financial Services Software shares gained 2.87% on June 24, 2026, to trade at INR 10,146.00. The stock opened at INR 9,903.00 and climbed to an intraday high of INR 10,284.00 before easing slightly. Trading volume reached 4.19 lakh shares, while traded value stood at INR 425.40 crore. The stock remained near its 52-week high of INR 10,584.50 and continued to outperform the Nifty IT index across key return periods.
Summary
Oracle Financial Services Software shares traded at INR 10,146.00 on June 24, 2026, approximately 4.1% below their 52-week high of INR 10,584.50. The company reported standalone net profit of INR 1,11,110 lakh and consolidated net profit of INR 84,170 lakh for the March 2026 quarter. The stock has substantially outperformed the Nifty IT index across one-year, three-year and five-year periods while remaining near record levels.
FAQs
Q: How far is Oracle Financial Services Software from its 52-week high?
A: The stock is trading approximately 4.1% below its 52-week high of INR 10,584.50.
Q: What was Oracle Financial Services Software's standalone net profit in Q4 FY26?
A: The company reported standalone net profit of INR 1,11,110 lakh for the March 2026 quarter.
Q: How has OFSS performed compared with the Nifty IT index?
A: The stock has outperformed the Nifty IT index across all reported return periods.