
Highlights
- TCS shares gained over 1% during active NSE trading on May 15, 2026.
- Stock rebounded after touching its 52-week low in the previous session.
- Trading volumes crossed 17 lakh shares amid continued IT sector activity.
Shares of Tata Consultancy Services Limited (NSE:TCS) traded higher on May 15, 2026, with the stock rising 1.52% to ₹2,280.10 during morning trade on the National Stock Exchange. The stock opened at ₹2,252.00 and touched an intraday high of ₹2,304.90.
TCS shares traded above the previous closing price of ₹2,246.00 throughout the session. Trading activity remained active, with volumes reaching 17.17 lakh shares and traded value standing at ₹393.21 crore. The stock recorded a VWAP of ₹2,289.75 during the session.
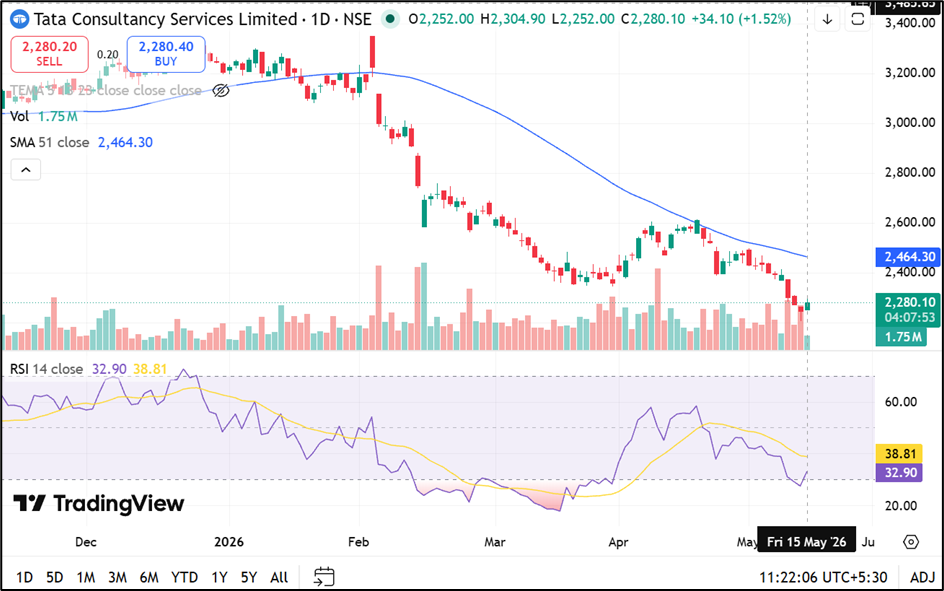
Source: Trading View
Stock Recovers After Fresh 52-Week Low
TCS shares moved higher after recording a 52-week low of ₹2,206.40 on May 14, 2026. The stock remains significantly below its 52-week high of ₹3,600.00 touched on May 15, 2025.
The company’s market capitalisation stood at ₹8,24,308.88 crore, while free float market capitalisation was reported at ₹2,31,921.92 crore.
The stock has remained under pressure across multiple time periods. TCS shares declined 4.68% over one week and 10.67% over one month. On a year-to-date basis, the stock fell 29.28%, compared to the NIFTY 50 decline of 9.18% during the same period.
Long-Term Returns Remain Negative
Over a one-year period, TCS shares declined 36.24%. The stock also recorded a negative return of 29.88% over three years and declined 25.20% over five years.
Despite the decline in longer-term performance, delivery-based participation remained notable during the session, with deliverable quantity accounting for 51.07% of traded quantity.
The stock’s annualised volatility stood at 28.28%, while daily volatility was reported at 1.48%.
IT Services Business Continues Global Operations
Tata Consultancy Services operates as part of the Tata Group and provides IT services, consulting and business solutions globally.
The company offers consulting-led and technology-driven services across business, engineering and digital transformation segments. TCS has operated in global technology services markets for more than five decades.
Source: Company Filing
Key Risks
- Global slowdown in technology spending may affect enterprise project demand.
- Currency exchange fluctuations can impact overseas revenue and earnings visibility.
- Rising employee costs may pressure operating margins across business segments.
- Competitive IT pricing environment may impact revenue growth opportunities.
Summary
TCS shares rose 1.47% on May 15, 2026, after touching a fresh 52-week low in the previous trading session. The stock traded above ₹2,300 during intraday trade while volumes crossed 17 lakh shares on NSE. Despite the day’s recovery, TCS remains under pressure across one-year, three-year and five-year return periods amid weakness in broader IT sector performance.
FAQs
Q: What was TCS share price on May 15, 2026?
A: TCS shares traded at ₹2,279.00 during morning trading on the National Stock Exchange.
Q: What is TCS’s 52-week low level?
A: TCS recorded its 52-week low of ₹2,206.40 on May 14, 2026.
Q: How much has TCS stock declined in 2026 so far?
A: TCS shares declined 29.28% on a year-to-date basis as of May 15, 2026.