
Highlights
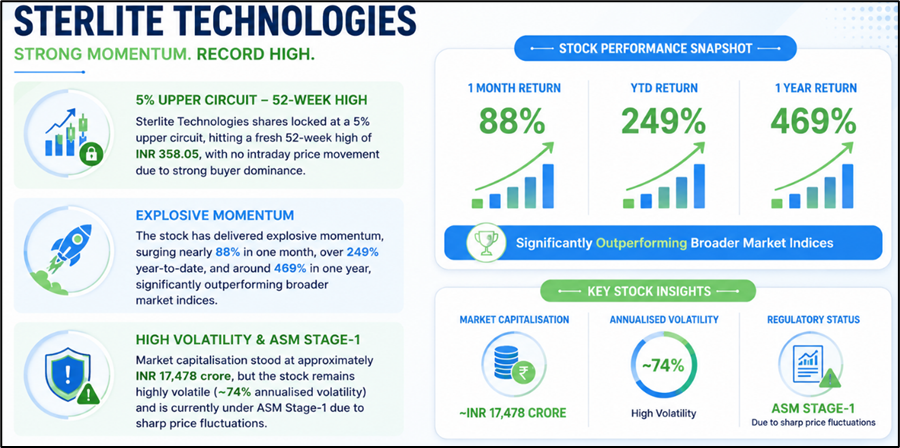
- Sterlite Technologies Limited locked at 5 percent upper circuit during Thursday’s session.
- The stock hit a fresh 52-week high of INR 358.05 on May 7, 2026.
- Strong monthly momentum shows nearly 88 percent gain over one month.
Shares of Sterlite Technologies Limited (NSE:STLTECH) surged to INR 358.05 on May 7, 2026, hitting the upper circuit limit for the day.
The stock opened, traded, and closed at the same level of INR 358.05, indicating no intraday price variation due to circuit limit conditions. This also marked its 52-week high level, while the 52-week low stood at INR 59.26.
Strong Momentum in Recent Periods
Sterlite Technologies has shown sharp momentum across short-term and medium-term timeframes.
Over the past one month, the stock gained 88.52 percent compared with 9.38 percent rise in the broader NIFTY Total Market index. On a one-week basis, it rose 21.46 percent versus 2.43 percent for the benchmark.
Year-to-date performance shows a sharp rise of 249.32 percent, while the one-year return stands at 469.33 percent, indicating strong sector-led re-rating.
Source: NSE
Trading Activity and Market Position
The stock recorded traded volume of 6.06 lakh shares with traded value of INR 21.69 crore.
Market capitalisation stood at INR 17,477.59 crore, while free-float market capitalisation was INR 9,531.89 crore.
The stock is currently under ASM Stage-1 framework, with a 5 percent price band and high annualised volatility of 74.32 percent.
Business Overview of Sterlite Technologies
Sterlite Technologies Limited was formed in 2001 following the demerger of Sterlite Industries’ telecom division.
The company later expanded into power transmission cables through acquisition of transmission line assets in 2006.
It operates as one of India’s largest optical fibre and optical fibre cable manufacturers and maintains a presence in global optical fibre markets.
The company serves telecom infrastructure requirements, including fibre connectivity and network solutions across domestic and international markets.
Data Source: Company Filing
Sector Trend and Market Behaviour
The telecom infrastructure and optical fibre segment has seen increased activity driven by data demand, broadband expansion, and network upgrades.
Sterlite Technologies’ recent price action reflects heightened speculative interest and momentum-driven trading behaviour in the small and mid-cap telecom infrastructure space.
Key Risks
- Extreme volatility due to upper circuit and ASM classification restrictions.
- Dependence on telecom capex cycles and global fibre demand fluctuations.
- Liquidity concentration increases sharp price movement risk.
- Regulatory or margin tightening may impact trading activity.
Summary
Sterlite Technologies (NSE:STLTECH) shares hit a 52-week high of INR 358.05 on May 7, 2026, locking at a 5 percent upper circuit. The stock has shown strong short-term momentum, rising sharply over the past month and year. The company operates in optical fibre and telecom infrastructure, serving both domestic and global markets.
FAQs
Q: Why did Sterlite Technologies hit an upper circuit?
A: The stock hit a 5 percent upper circuit due to strong buying momentum and limited supply.
Q: What is Sterlite Technologies’ 52-week high?
A: The stock reached INR 358.05, which is also its 52-week high level.
Q: What business does Sterlite Technologies operate in?
A: The company manufactures optical fibre, cables, and telecom infrastructure solutions globally.