
Highlights
- Infosys shares rose 1.30% during Monday’s trading session on NSE.
- The stock touched an intraday high of INR 1,136.80 amid active market trading.
- Infosys reported negative returns across one-year, three-year, and five-year periods.
Infosys Limited (NSE:INFY) shares traded higher on May 18, 2026, with the stock advancing 1.30% to INR 1,133.50 on the National Stock Exchange (NSE). The stock opened at INR 1,119.00 and touched an intraday high of INR 1,136.80, while the session low stood at INR 1,118.00. The previous closing price was INR 1,119.00.
Traded volume stood at 57.53 lakh shares, while traded value reached INR 649.89 crore. The stock’s volume-weighted average price (VWAP) was recorded at INR 1,129.65.
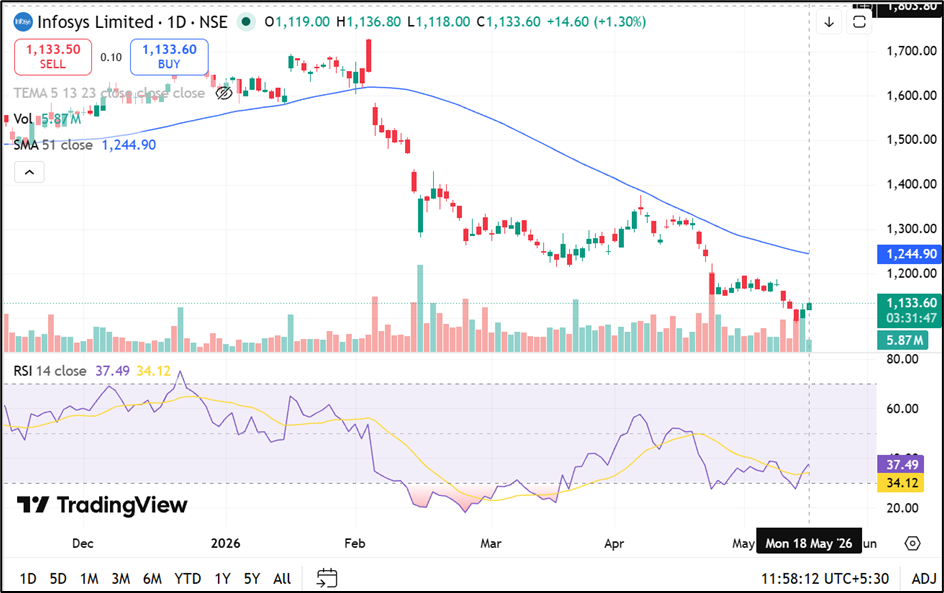
Source: Trading View
Market Capitalisation and Trading Metrics
Infosys’ total market capitalisation stood at INR 4,59,704.91 crore, while free float market capitalisation was reported at INR 3,96,361.28 crore. The stock’s impact cost remained at 0.02, indicating high liquidity during the session.
Deliverable quantity as a percentage of traded quantity stood at 52.56%, while the applicable margin rate was recorded at 14.21%. The company’s face value remains INR 5 per share.
Stock Performance Across Different Periods
Infosys reported weak performance across several timeframes compared with the benchmark NIFTY 50 index. The stock declined 3.70% over one week and 14.04% over one month, underperforming the benchmark index during both periods.
On a year-to-date basis, Infosys declined 30.45%, compared with a 10.11% fall in the NIFTY 50. The stock also reported negative returns across longer periods. Infosys declined 28.71% over one year, 9.03% over three years, and 15.41% over five years.
52-Week Range and Volatility Levels
Infosys touched its 52-week high of INR 1,728.00 on February 3, 2026, while the 52-week low stood at INR 1,089.00 on May 14, 2026. The stock’s upper trading band was recorded at INR 1,230.90, while the lower band stood at INR 1,007.10. Daily volatility stood at 1.70%, while annualised volatility was reported at 32.48%.
Company Operations and Business Profile
Infosys Limited provides consulting, technology, outsourcing, and digital transformation services to clients across industries.
The company operates in information technology and next-generation digital services. Infosys is recognised as India’s second-largest information technology company after Tata Consultancy Services.
Source : Company Filing
Key Risks
- Global technology spending slowdown may affect client project demand.
- Currency fluctuations could influence export revenue and profitability.
- Competitive pressure may impact pricing across IT service contracts.
- Delays in digital transformation spending may affect revenue growth.
Summary
Infosys (NSE:INFY) shares traded higher by more than 1% during Monday’s NSE session, despite weak long-term stock performance across multiple periods. The company continued to witness active trading volumes and maintained a market capitalisation above INR 4.59 lakh crore. Investors tracked Infosys’ short-term recovery, volatility levels, and broader developments in the information technology sector.
FAQs
Q: Why did Infosys shares rise on May 18, 2026?
A: Infosys shares gained 1.30% during NSE trading amid buying interest in information technology stocks.
Q: What is Infosys’ 52-week high price?
A: Infosys touched its 52-week high of INR 1,728.00 on February 3, 2026.
Q: How has Infosys stock performed over one year?
A: Infosys declined 28.71% over the last one year compared with broader market benchmark performance.