
Shares of Leela Palaces Hotels & Resorts Limited (NSE:THELEELA) remained in focus after the luxury hospitality major reported record FY26 earnings performance supported by strong RevPAR growth, premium pricing strength, operational leverage, and rapid portfolio expansion across India and international markets.
The company delivered sharp profitability improvement during FY26 despite geopolitical disruptions impacting global travel demand during the March quarter. Investors continued tracking The Leela’s aggressive luxury expansion strategy, improving balance sheet, and premium positioning in India’s fast-growing luxury hospitality segment.
Record FY26 Profitability Highlights Strong Operating Leverage
Leela Palaces Hotels & Resorts reported FY26 total revenue of ₹15,978 million, reflecting 14% year-on-year growth, while EBITDA increased 16% to ₹8,133 million. Adjusted operating EBITDA rose 19% year-on-year to ₹7,429 million with adjusted operating EBITDA margin improving to 49%.
The company delivered exceptional bottom-line growth during FY26, with profit after tax surging nearly 8.5 times to ₹4,030 million compared with ₹477 million in FY25. Management attributed the sharp improvement to strong operating leverage, premium pricing gains, and substantial reduction in finance costs following debt repayment from IPO proceeds.
During Q4FY26, revenue from operations rose 14% year-on-year to ₹4,844 million, while quarterly EBITDA stood at ₹2,734 million. Net profit for the quarter climbed 46% year-on-year to ₹1,717 million despite geopolitical disruptions affecting travel flows.
Luxury Hospitality Demand Continues Supporting Pricing Power
The Leela continued outperforming the broader luxury hospitality industry through superior pricing power and market share gains.
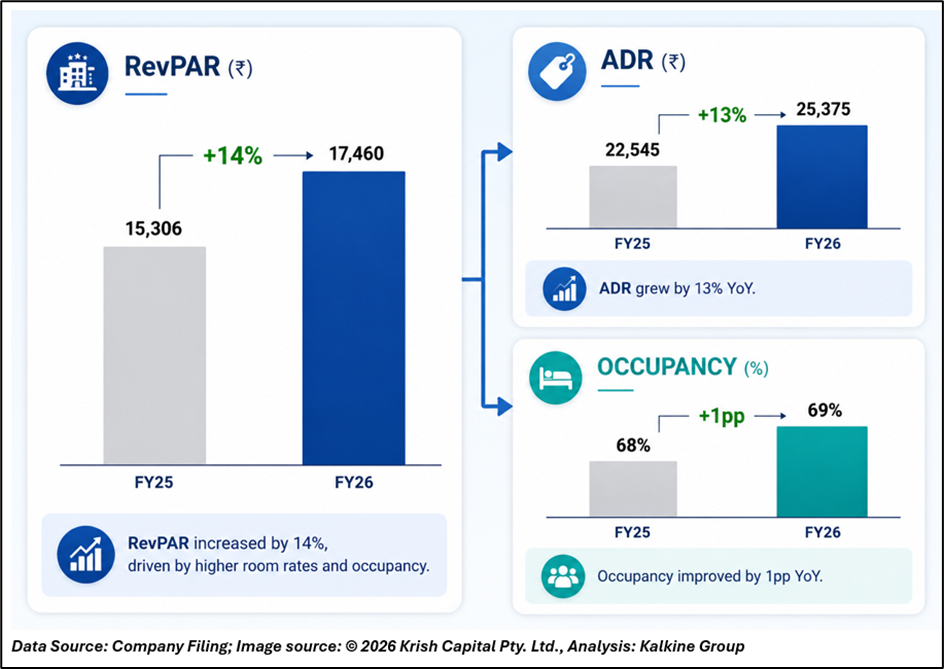
The company reported FY26 RevPAR growth of 14% year-on-year to ₹17,460, significantly outperforming the India luxury hospitality segment growth of 6%. RevPAR premium versus the India luxury segment improved to 1.5x during FY26.
Average daily room rate (ADR) increased 13% year-on-year to ₹25,375, while occupancy improved to 69% during FY26.
In Q4FY26, RevPAR rose 6% year-on-year to ₹23,028 despite geopolitical headwinds, while ADR increased 15% to ₹32,059. However, occupancy declined to 72% from 78% in the year-ago quarter due to war-related disruptions impacting international travel demand.
The company also maintained industry-leading customer engagement metrics, with Net Promoter Score (NPS) improving to 86 during FY26 versus industry average of 74.
Aggressive Expansion Strategy Strengthens Long-Term Growth Outlook
Leela continued accelerating its luxury expansion strategy during FY26 through acquisitions, management contracts, and new developments.
The company added four hotels during FY26 including projects in Mumbai BKC, Dubai Palm Jumeirah, Jaisalmer, and Coorg, increasing key inventory by 23% year-on-year to 966 keys.
Its total operational and pipeline portfolio now stands at 24 properties with 5,227 luxury keys across owned and managed assets.
A major highlight during the year was acquisition of The Leela Coorg Forest Sanctuary, an ultra-luxury 71-villa resort in Coorg with additional expansion potential.
The company is also expanding through luxury projects in Srinagar, Bandhavgarh, Sikkim, Ayodhya, Agra, Ranthambore, and Mumbai BKC. The pipeline currently includes more than 1,000 additional keys scheduled across CY26–CY30.
Management highlighted that India’s rising wealthy population, premium consumption growth, and limited supply in luxury hospitality continue supporting long-term industry tailwinds.
Balance Sheet Strength Improves Significantly
The Leela significantly strengthened its balance sheet during FY26 after utilizing IPO proceeds to reduce debt.
Net debt declined sharply from ₹25,677 million in FY25 to ₹12,707 million in FY26, while net debt-to-EBITDA improved to 1.6x from 3.7x.
The company repaid nearly ₹23,000 million of borrowings through IPO proceeds, substantially improving financial flexibility for future expansion opportunities.
Technical Summary
Leela Palaces Hotels & Resorts Limited is currently trading near ₹418.65, slightly below its 51-day EMA at ₹423.25, indicating a cautious near-term trend. RSI around 48 reflects neutral momentum with limited directional strength. The stock is witnessing range-bound movement, with support near ₹410, while resistance is placed around ₹430 levels in the short term.
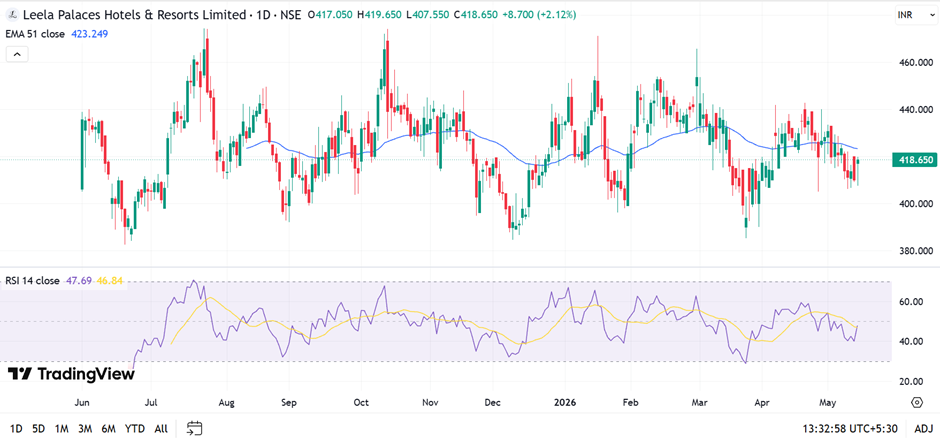
Chart by TradingView
Conclusion
Leela Palaces Hotels & Resorts delivered one of the strongest FY26 performances within India’s hospitality sector, driven by premium pricing power, operational efficiency, and sharp profitability expansion. Its luxury-focused positioning, strong balance sheet, expanding portfolio, and aggressive pipeline strategy continue strengthening long-term growth visibility amid rising luxury consumption trends in India.
FAQs
- Why are Leela Palaces Hotels shares in focus?
The company reported record FY26 profitability alongside aggressive luxury hospitality expansion across India and international markets.
- What was Leela Palaces’ FY26 PAT growth?
Profit after tax surged to ₹4,030 million in FY26 from ₹477 million in FY25.
- How many luxury keys does Leela currently operate?
The company has 24 operational and pipeline properties comprising 5,227 luxury keys globally.